Project Summary

Introduction

Neuroscience is the scientific study of the nervous system, a complex organ system inside every animal on planet Earth. Since its birth as a distinct scientific discipline in the 1950s and 1960s, neuroscience has concentrated its efforts on “interventionist” laboratory experiments with mice and rats, in which the experimenter manipulates some aspect of the nervous system and carefully observes the effects of that manipulation. This method has been very productive for the last 60 years, and has motivated the rapid development of ever more precise tools for physical and chemical manipulation of nervous system cells and molecules. Unfortunately, these techniques have not been enough to meaningfully connect the cellular and molecular activity of nervous systems to the behaviour and well-being of whole organisms.

Several clues point to a need for neuroscience to expand its work out of the laboratory setting and “into the wild”. Nervous systems evolved for millions of years into countless forms and in unknown, unpredictable environments before we built laboratories; yet, the vast majority of brains we currently study are from only a few species which have been bred for generations in laboratory settings. We are discovering that the differences between an anaesthetized brain, a brain in a restrained animal, and a brain in a freely moving animal can be profound, even when studying neuroscience topics other than movement. We are also discovering that nervous systems are incredibly sensitive to the details of both their immediate context and their past history. These clues, and more, have motivated me and my colleagues in the Intelligent Systems Lab to search for ways to validate laboratory results and techniques under more natural conditions and with larger, more diverse samples of research subjects.

“Surprising Minds”: an experiment embedded in an exhibit

While looking for collaborators with whom I could study neuroscience topics in cuttlefish, I developed a relationship with the Sea Life Centre in Brighton, UK, during the fall of 2016. I agreed to volunteer my time learning their marine animal husbandry procedures by helping with the daily tasks of maintaining the Behind the Scenes research laboratory space. In return, I would be allowed to conduct non-invasive behavioural experiments using their aquarium space, with newly hatched animals that the aquarium staff would help me raise. Unfortunately, no local cuttlefish eggs were found during the breeding seasons of 2017, and during the summer of 2017 a fault was found in one of the aquaculture systems, and the cuttlefish tanks had to be taken offline for repairs.

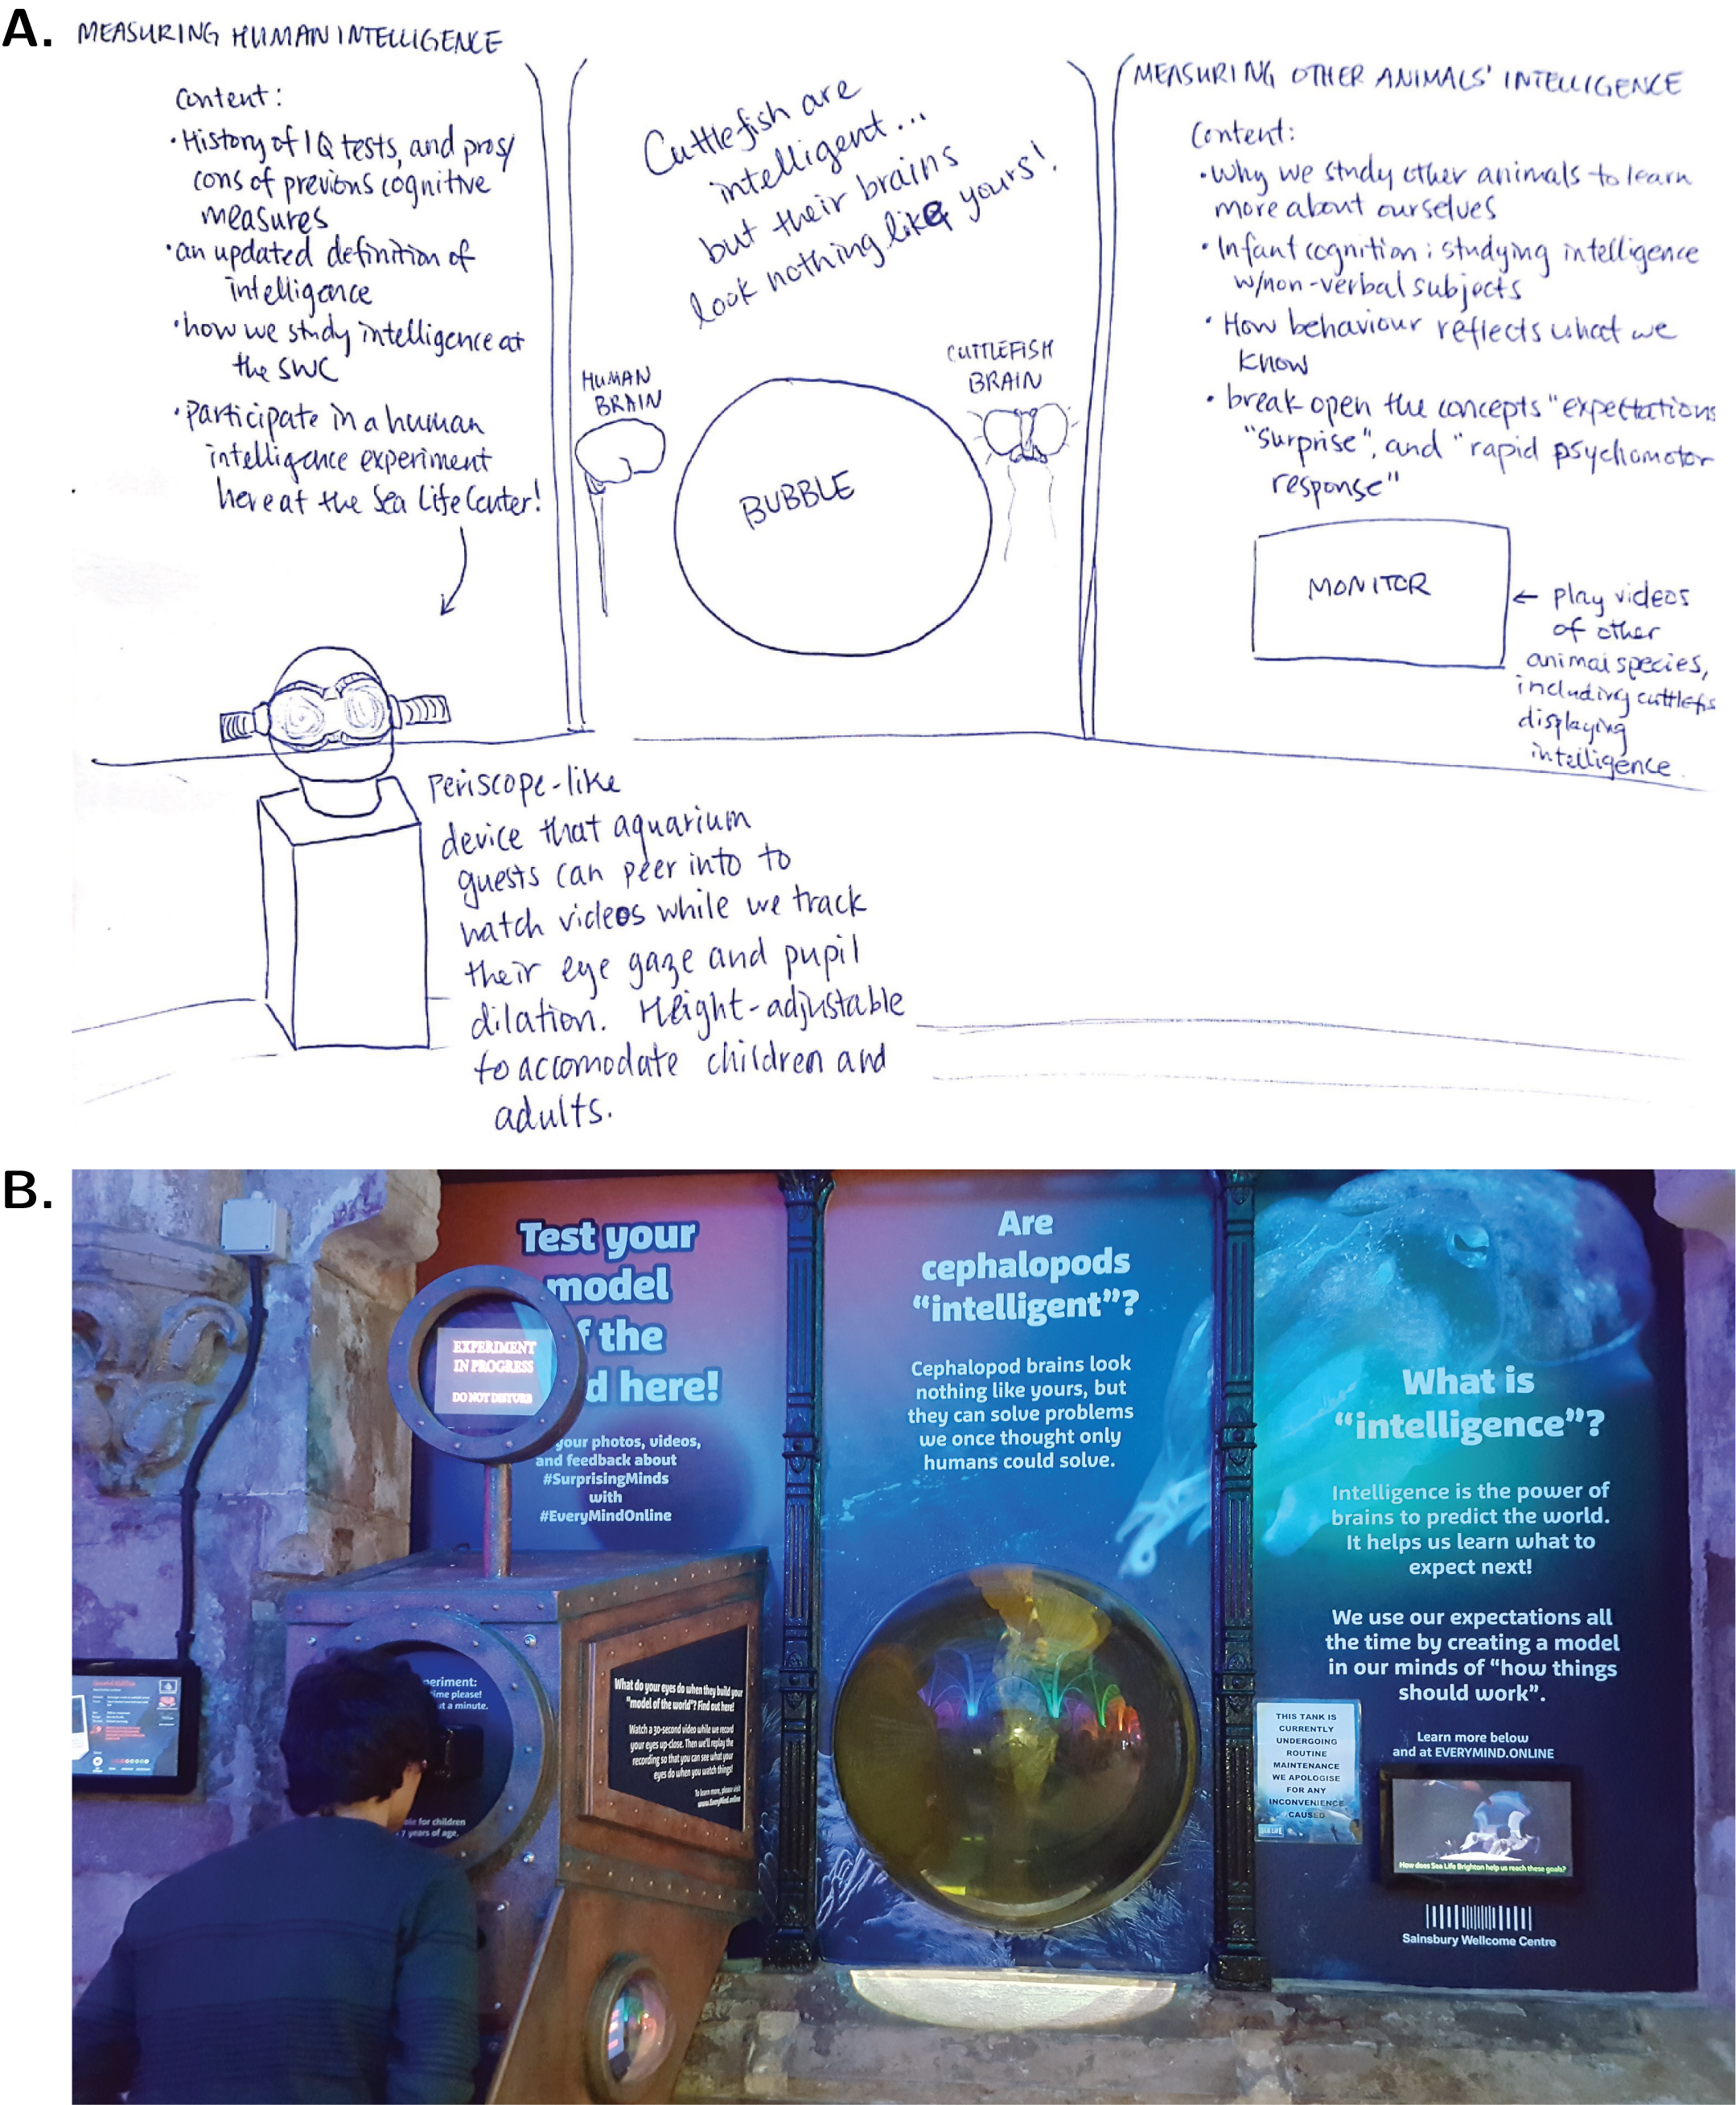
When it became clear that I would not be able to proceed with cuttlefish behaviour experiments as planned, my PhD advisor, Dr. Adam Kampff, encouraged me to propose a behaviour experiment for humans which could take advantage of the huge quantity and diversity of people visiting the Sea Life Centre, especially during the summers when school groups from all around the world visited the aquarium. After meeting with Sea Life Brighton’s display team and the communications manager at our London host institute, the Sainsbury Wellcome Centre, I was able to secure space and funding to develop and build an exhibit about intelligence, surprise, and how we can study neuroscience in both humans and cuttlefish.

We decided to structure the experiment around eye-tracking, for two reasons. One is that both humans and cuttlefish have fluid-filled, camera-like eyes, and pay much more attention to what we see than to information from any other sense/sensor. The second reason is because changes to pupil size in response to light, surprise, and cognitive load have been well-studied under traditional laboratory conditions. We felt that by focusing on eye-tracking as a behavioural neuroscience method allowed us to talk about theoretical topics such as convergent evolution of nervous systems across different species in addition to replicating and validating previous research with a much larger and diverse sample size.

Overall exhibit concept and design
Fig. 1: Overall concept design of our proof-of-concept large-N ‘in situ’ behavioral experiment with human subjects. A. Schematic of an interactive exhibit with embedded behavioral experiment, to be located in front of the cuttlefish display tank (labeled ‘BUBBLE’) at the Sea Life Centre aquarium in Bright, UK; sketch by Danbee Kim. B. Photo of the final exhibit, which remained on display at Sea Light Brighton until Sept 2020. The exihibit was installed in July 2017 and collected the data used in this summary from 10 October 2017 until 01 November 2018.

Installation and Pilot phase

During the first week of July 2017, “Surprising Minds” was installed next to the cuttlefish display tank in the Victorian Arcade of the Sea Life Centre in Brighton.

During July and August 2017, the exhibit was tended by a “host scientist”, who invited visitors at the Sea Life Centre to interact with the exhibit, explained the experiment embedded in the exhibit, and engaged in discussions about neuroscience topics such as optical illusions, blindsight, and the structure of the retina.

When visitors approached the exhibit, the host scientist invited them to look through the viewing plate and watch a 30 second long video clip while cameras record their eyes up close. Afterwards, the exhibit would replay the recording of their eyes so that visitors can see what their eyes do while they watch things.

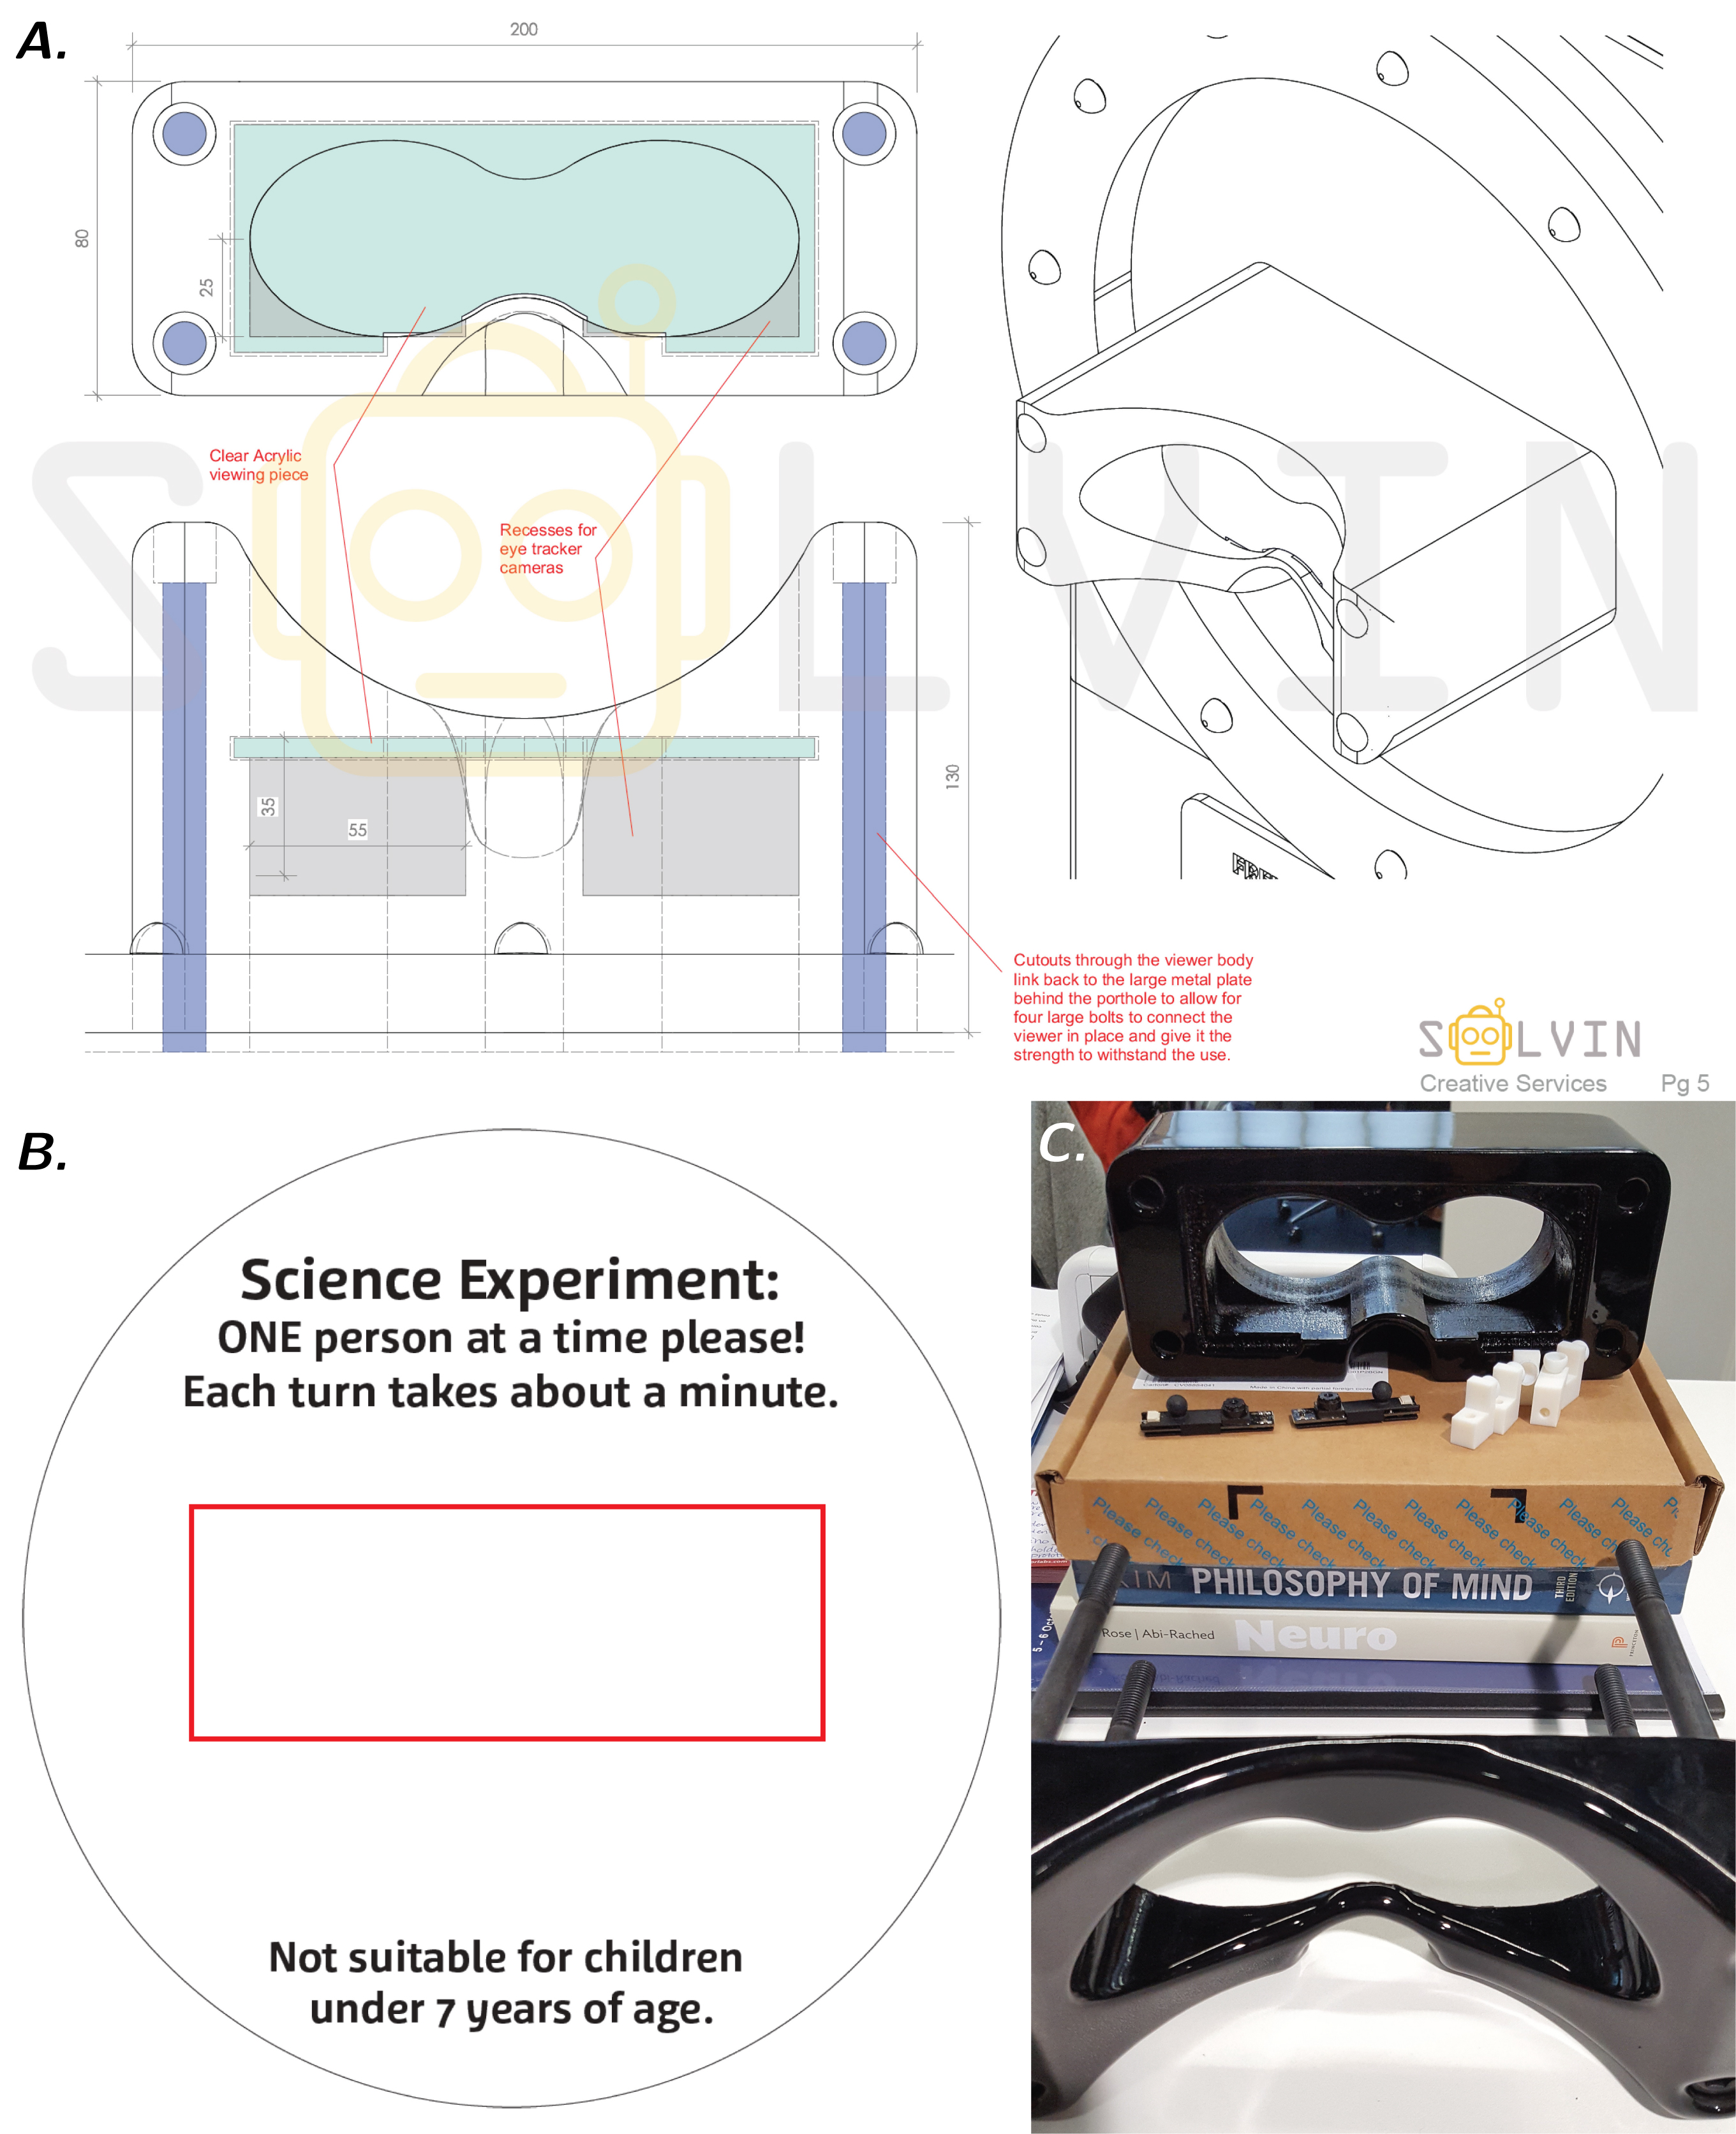
See Supplemental Figure 1a for details of the exhibit casing that held the experiment, including the original design of the viewing plate.

Exhibit and experiment hardware setup
Fig. 2: Schematic drawing of the hardware setup inside the Surprising Minds exhibit. The ‘world camera’ recorded the main display monitor from inside the exhibit and serves as a ‘ground truth’ record of each activation. The Intel NUC Mini PC coordinated all other components via the reactive programming language Bonsai, stored exhibit data, and backed up exhibit data on a Dropbox account via a wireless internet connection. Full details of exhibit control software can be found at https://github.com/everymind/SurprisingMinds-Exhibit.

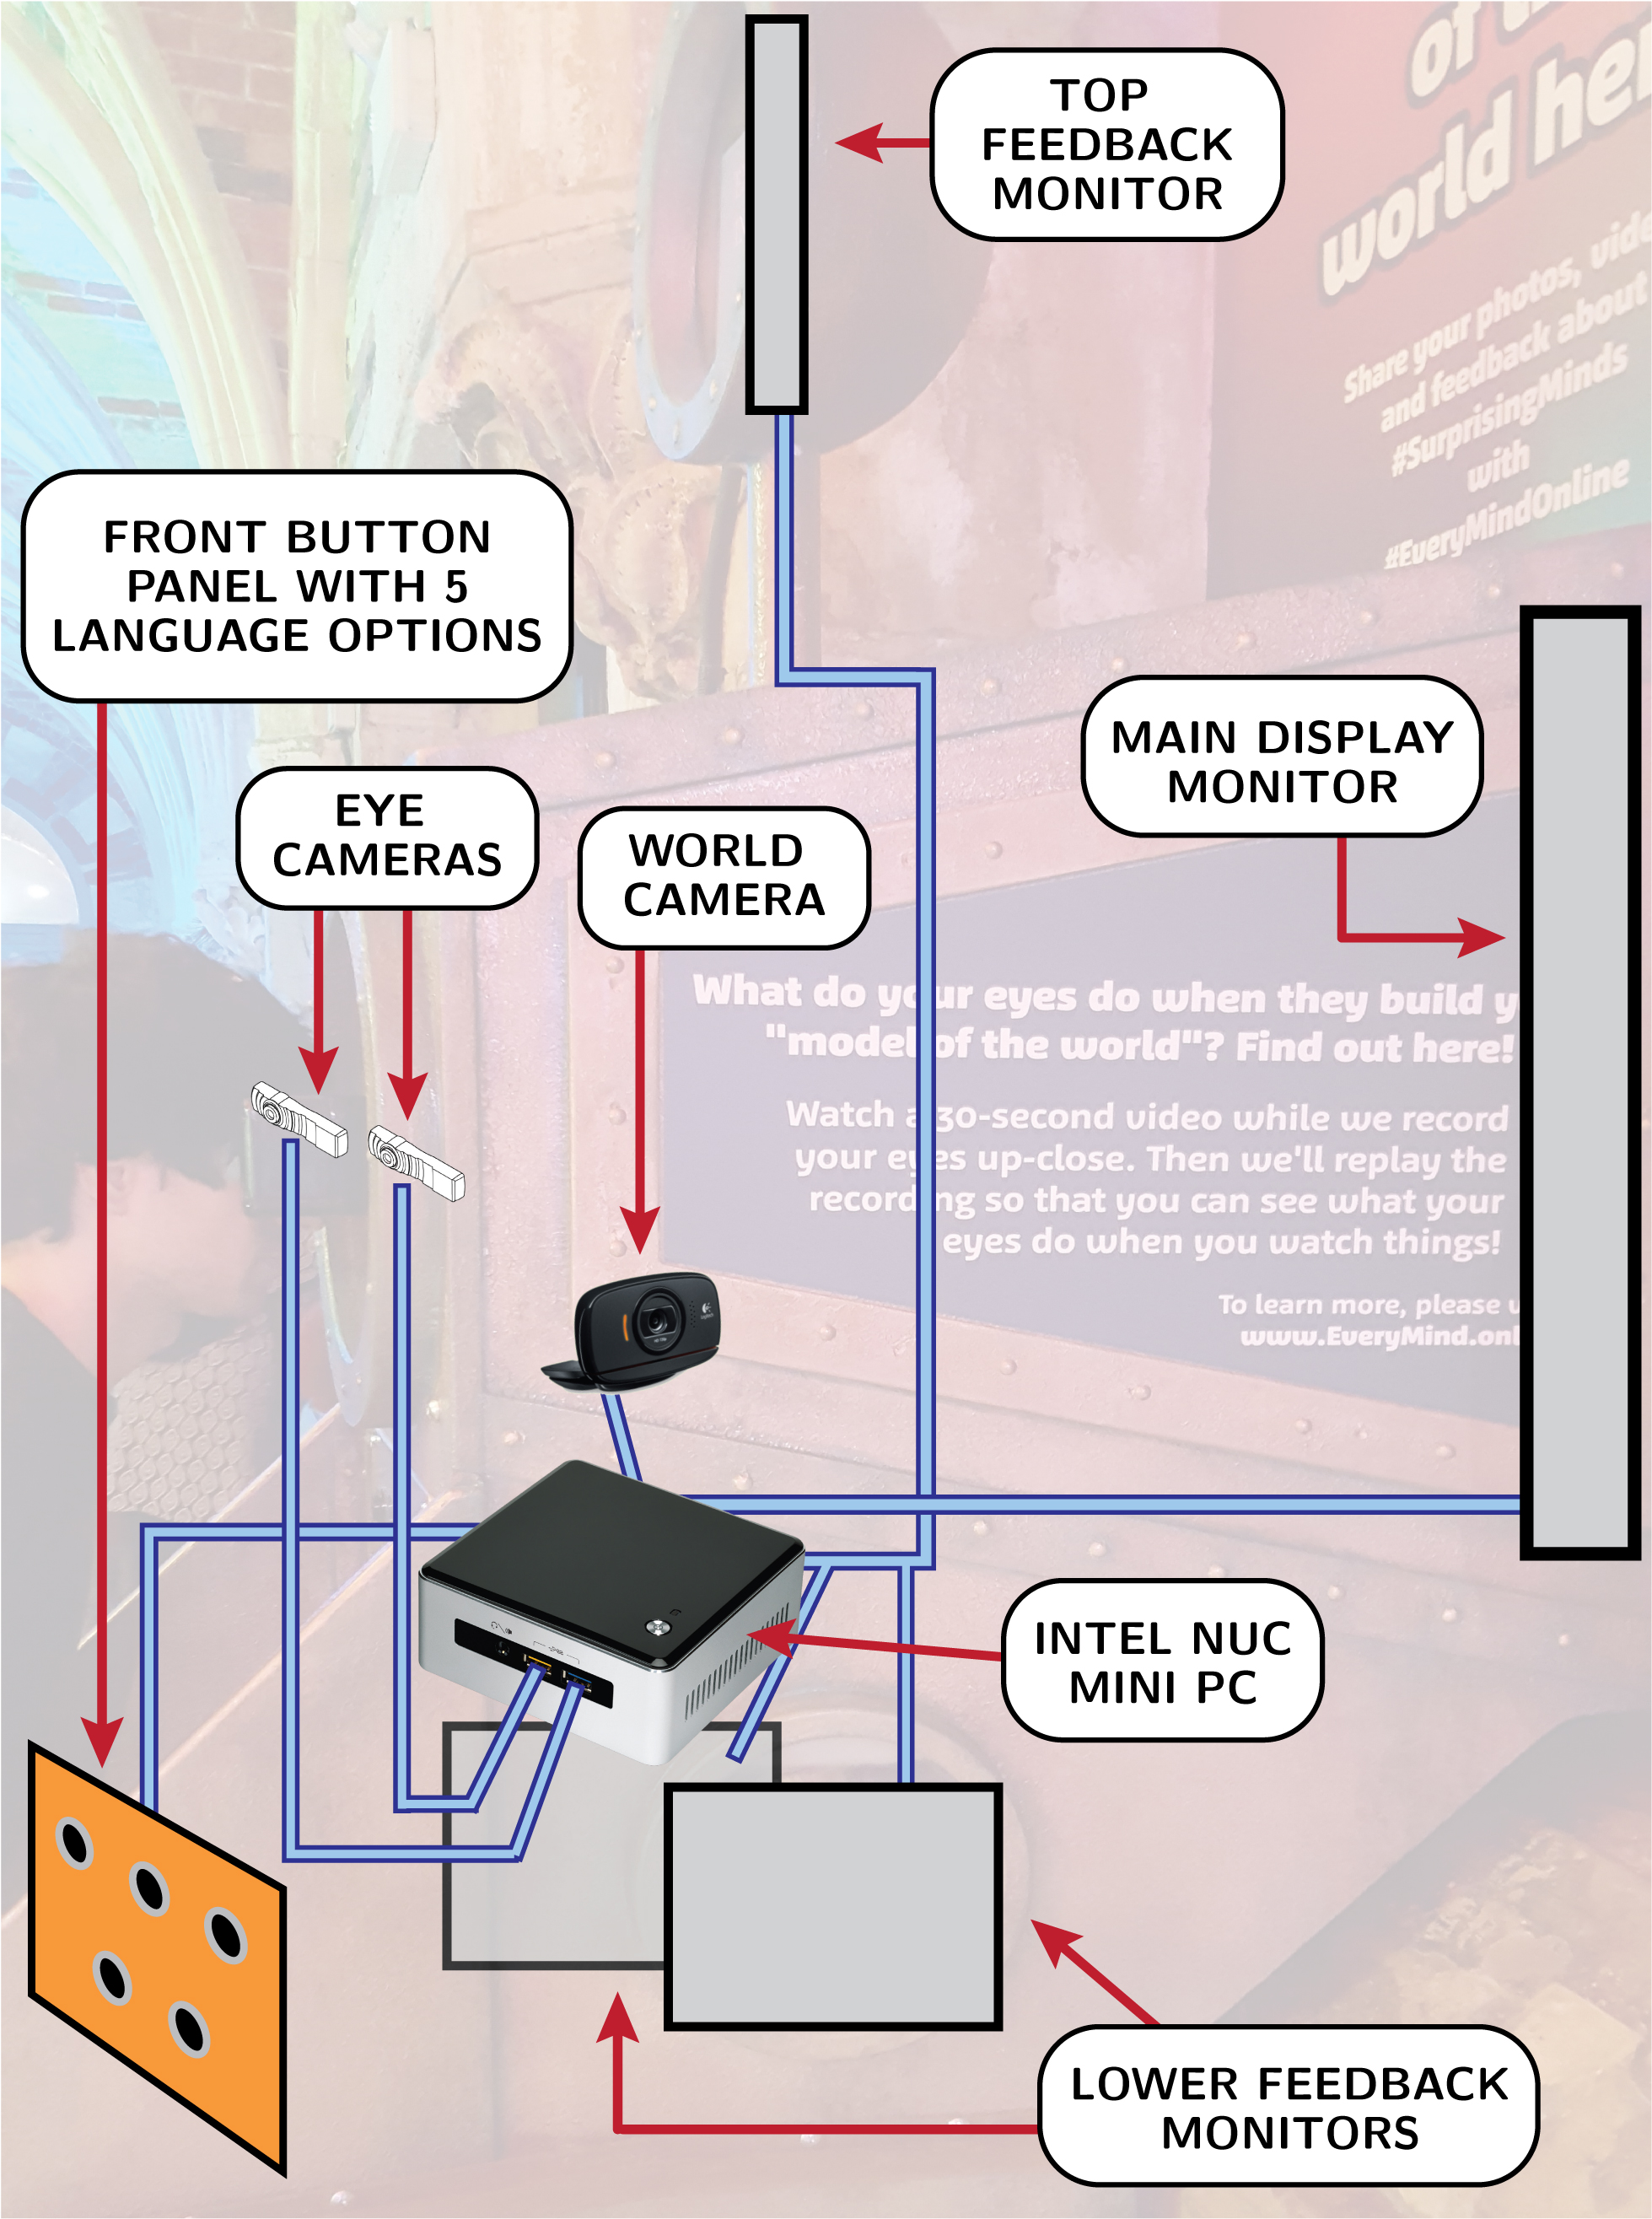
Every time a visitor activated the exhibit by pressing a language button, three cameras were activated - the two infrared “eye cameras” housed in the viewing plate, which recorded people’s eyes up close; and a usb web cam placed inside of the exhibit box, called the “world camera” or our “ground truth camera”, which recorded the main display monitor inside the exhibit box. At the same time, the external monitors on the top and sides of the exhibit box would change to display the text “Do not disturb, Experiment in Progress”.

See Supp. Fig. 1b for more documentation of the hardware components controlling the exhibit interaction and saving experiment data.

Experimental protocol
Fig. 3: The experiment protocol. Participants activate exhibit interactions by pressing a language button. After a calibration sequence, which also allows participants to adjust head placement in the viewing mask, participants each see two short video clips, which in total take 30-45 seconds to play.

Automating the exhibit

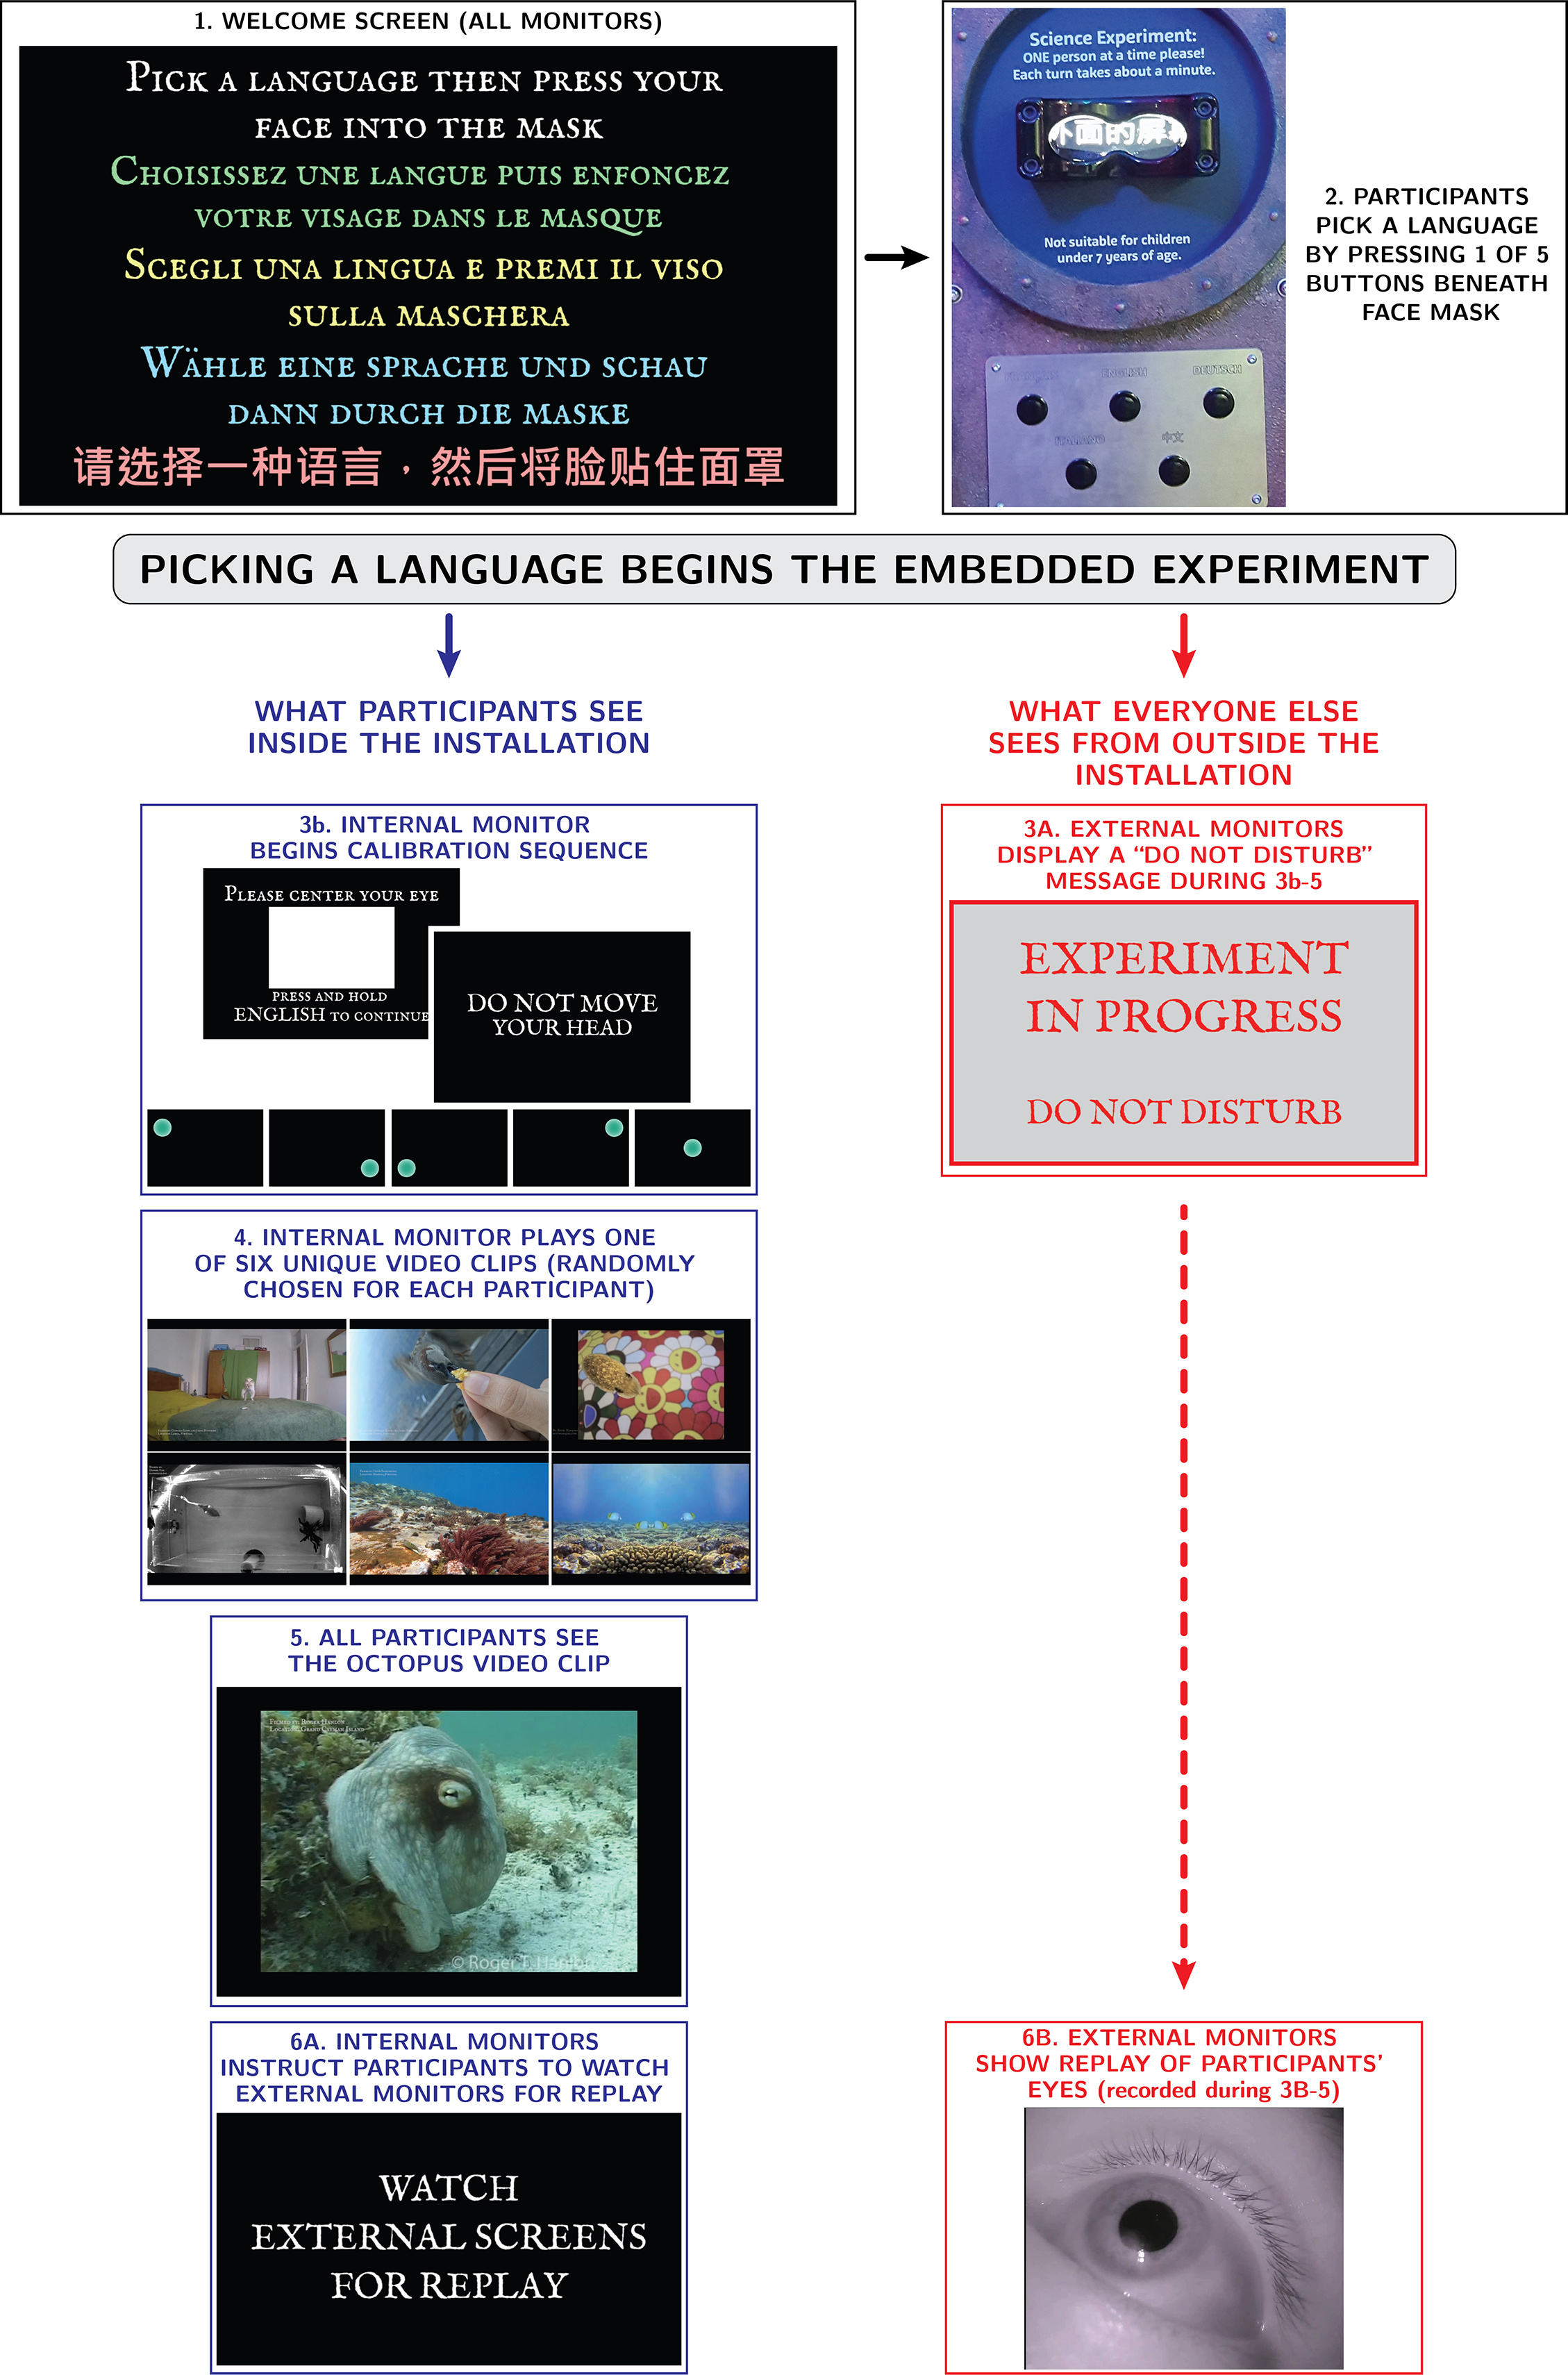
After August 2017, the exhibit was briefly taken offline in order to enable the exhibit to run without a human host. The human host was replaced with informative text on the outside of the exhibit casing, and written directions for participating in the experiment were translated into 4 other languages besides English. See Supp. Fig. 1c and 1d for additional details on the upgrades made to the exhibit in order to automate the exhibit interaction and collection of experimental data.

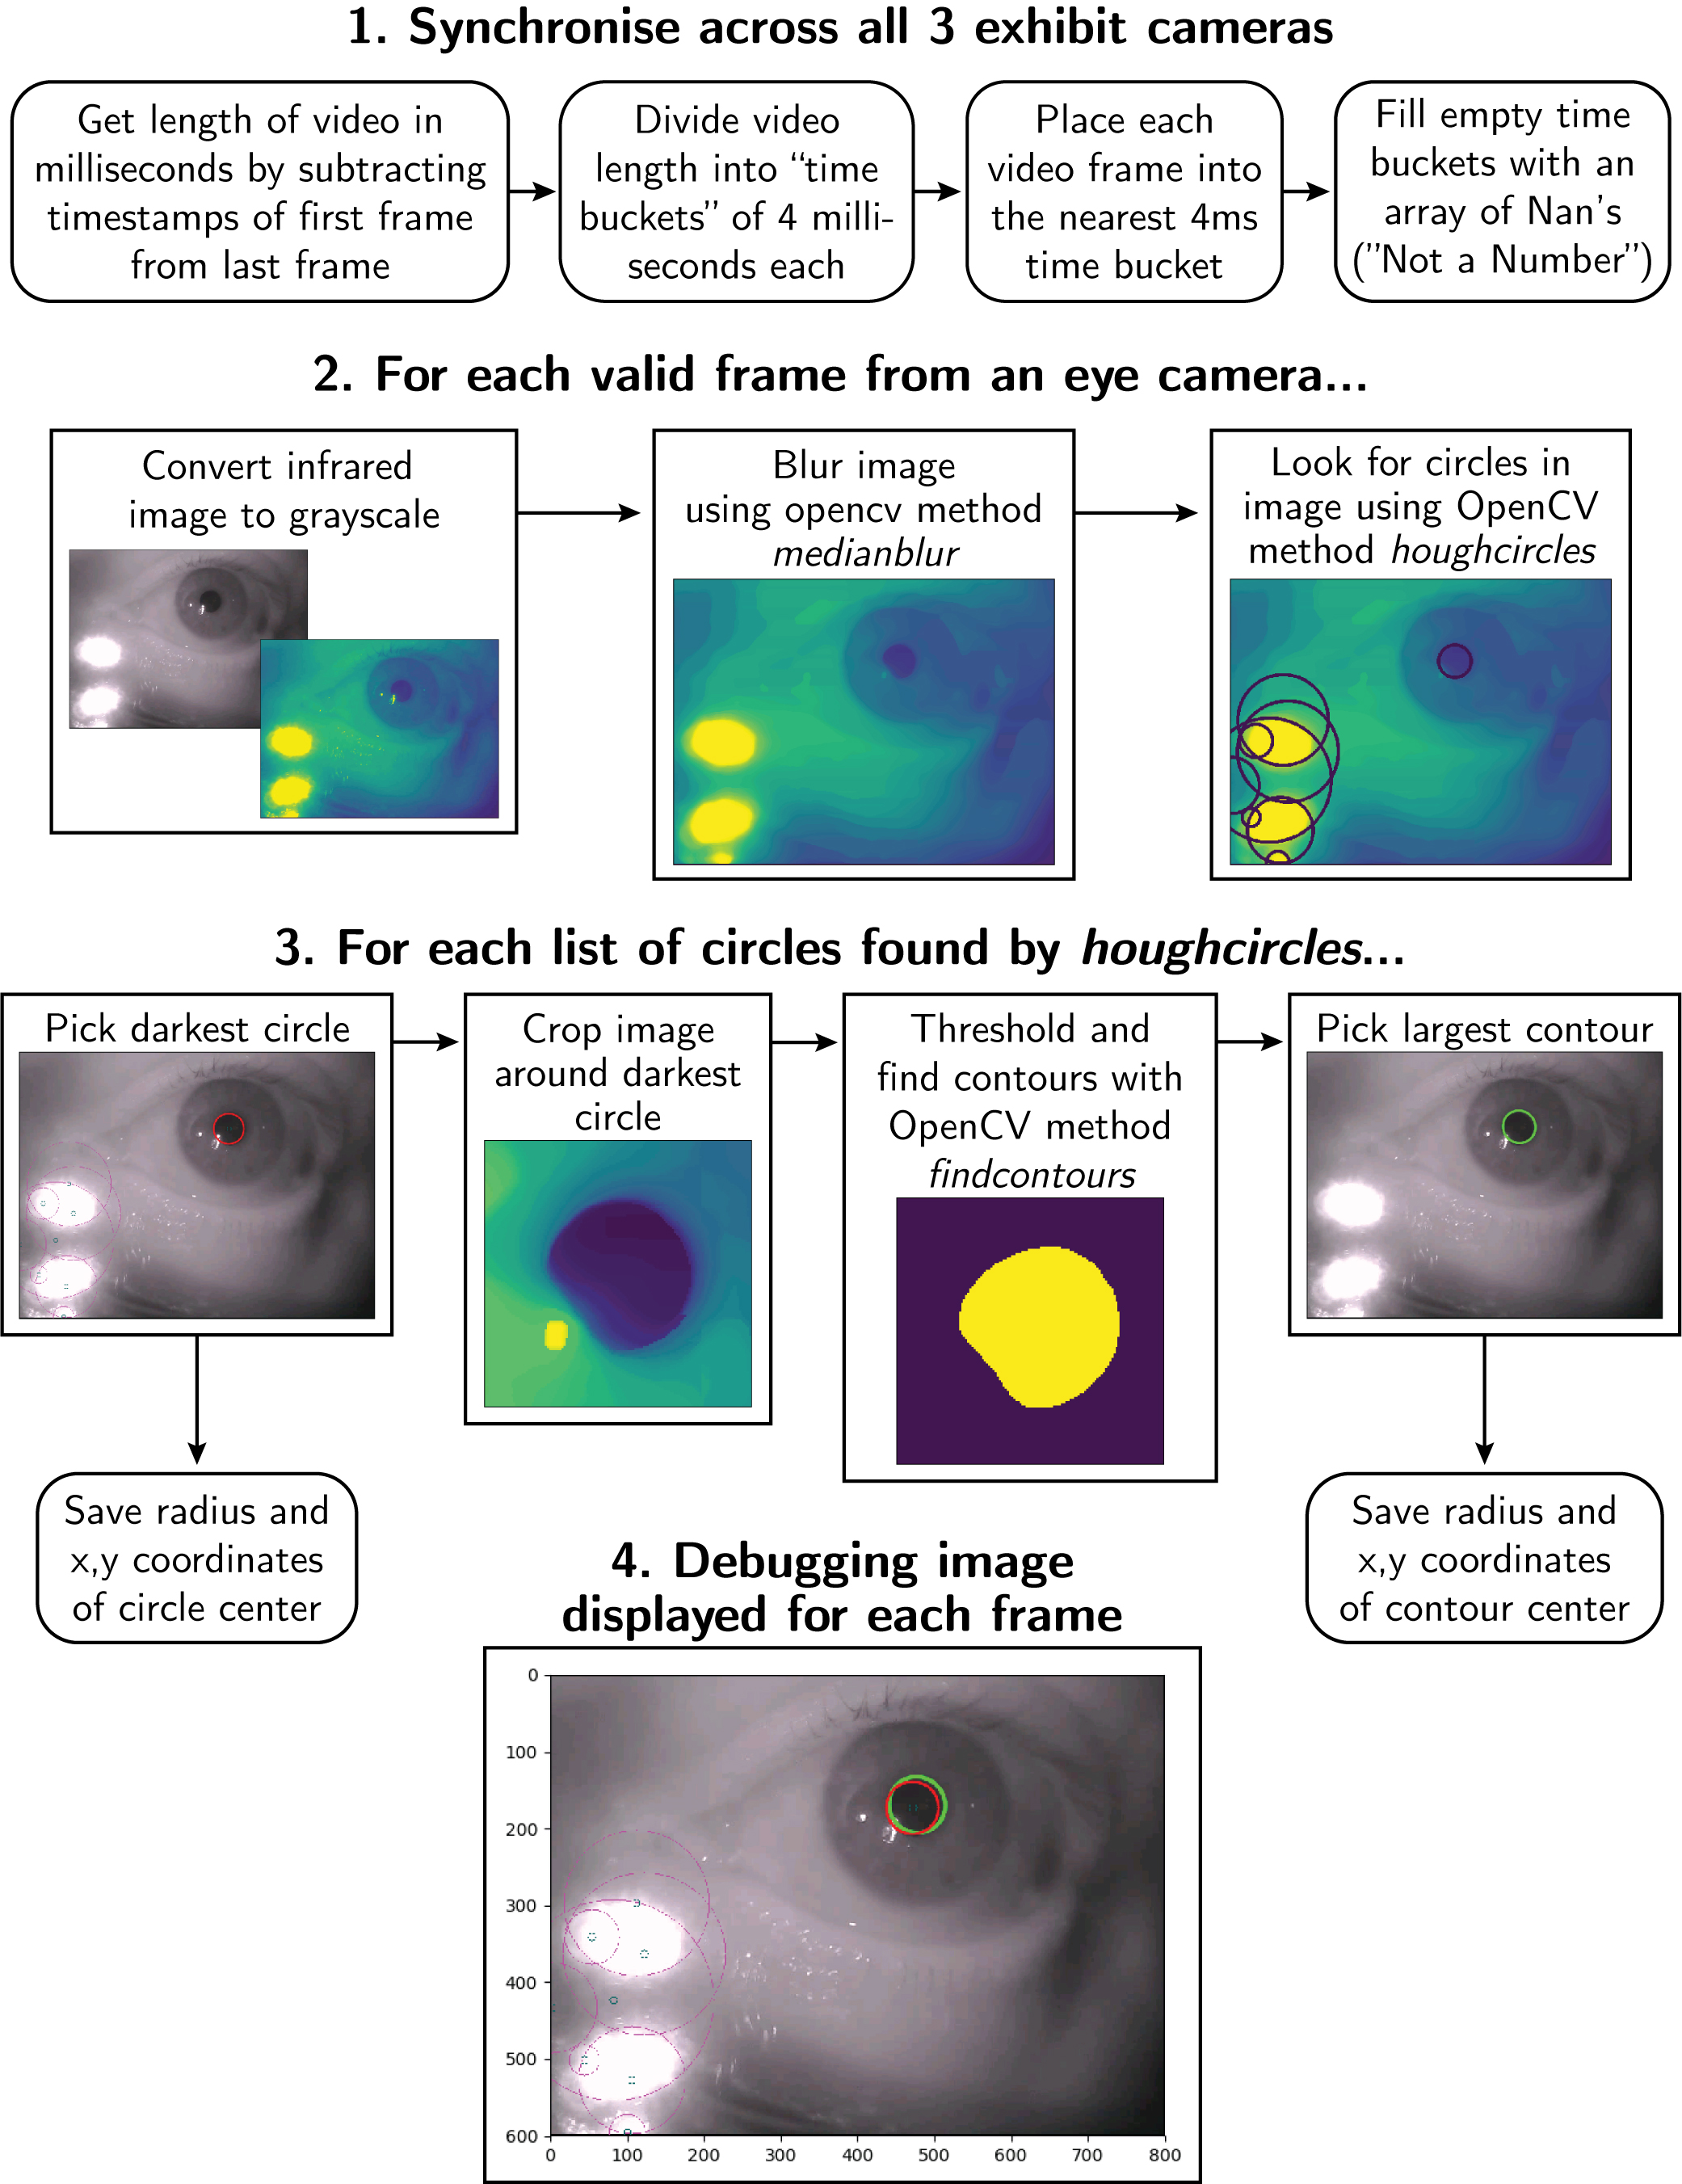
In order to analyse these videos, our analysis workflow needed to first synchronise all three videos, as the eye cameras and world camera ran at different frame rates. Then, for each frame in the eye recordings, our analysis workflow needed to find the pupil and measure the pupil’s area and the center of the pupil’s location in the frame. This information was then used to calculate changes in pupil size and motion.

Analysis pipeline
Fig. 4: Video analysis workflow, with example screenshots of the image processing done at each step in the pipeline. All analysis was done using the Python programming language and the OpenCV library. Full analysis scripts and logs can be found online at https://github.com/everymind/SurprisingMinds_Paper.

Results

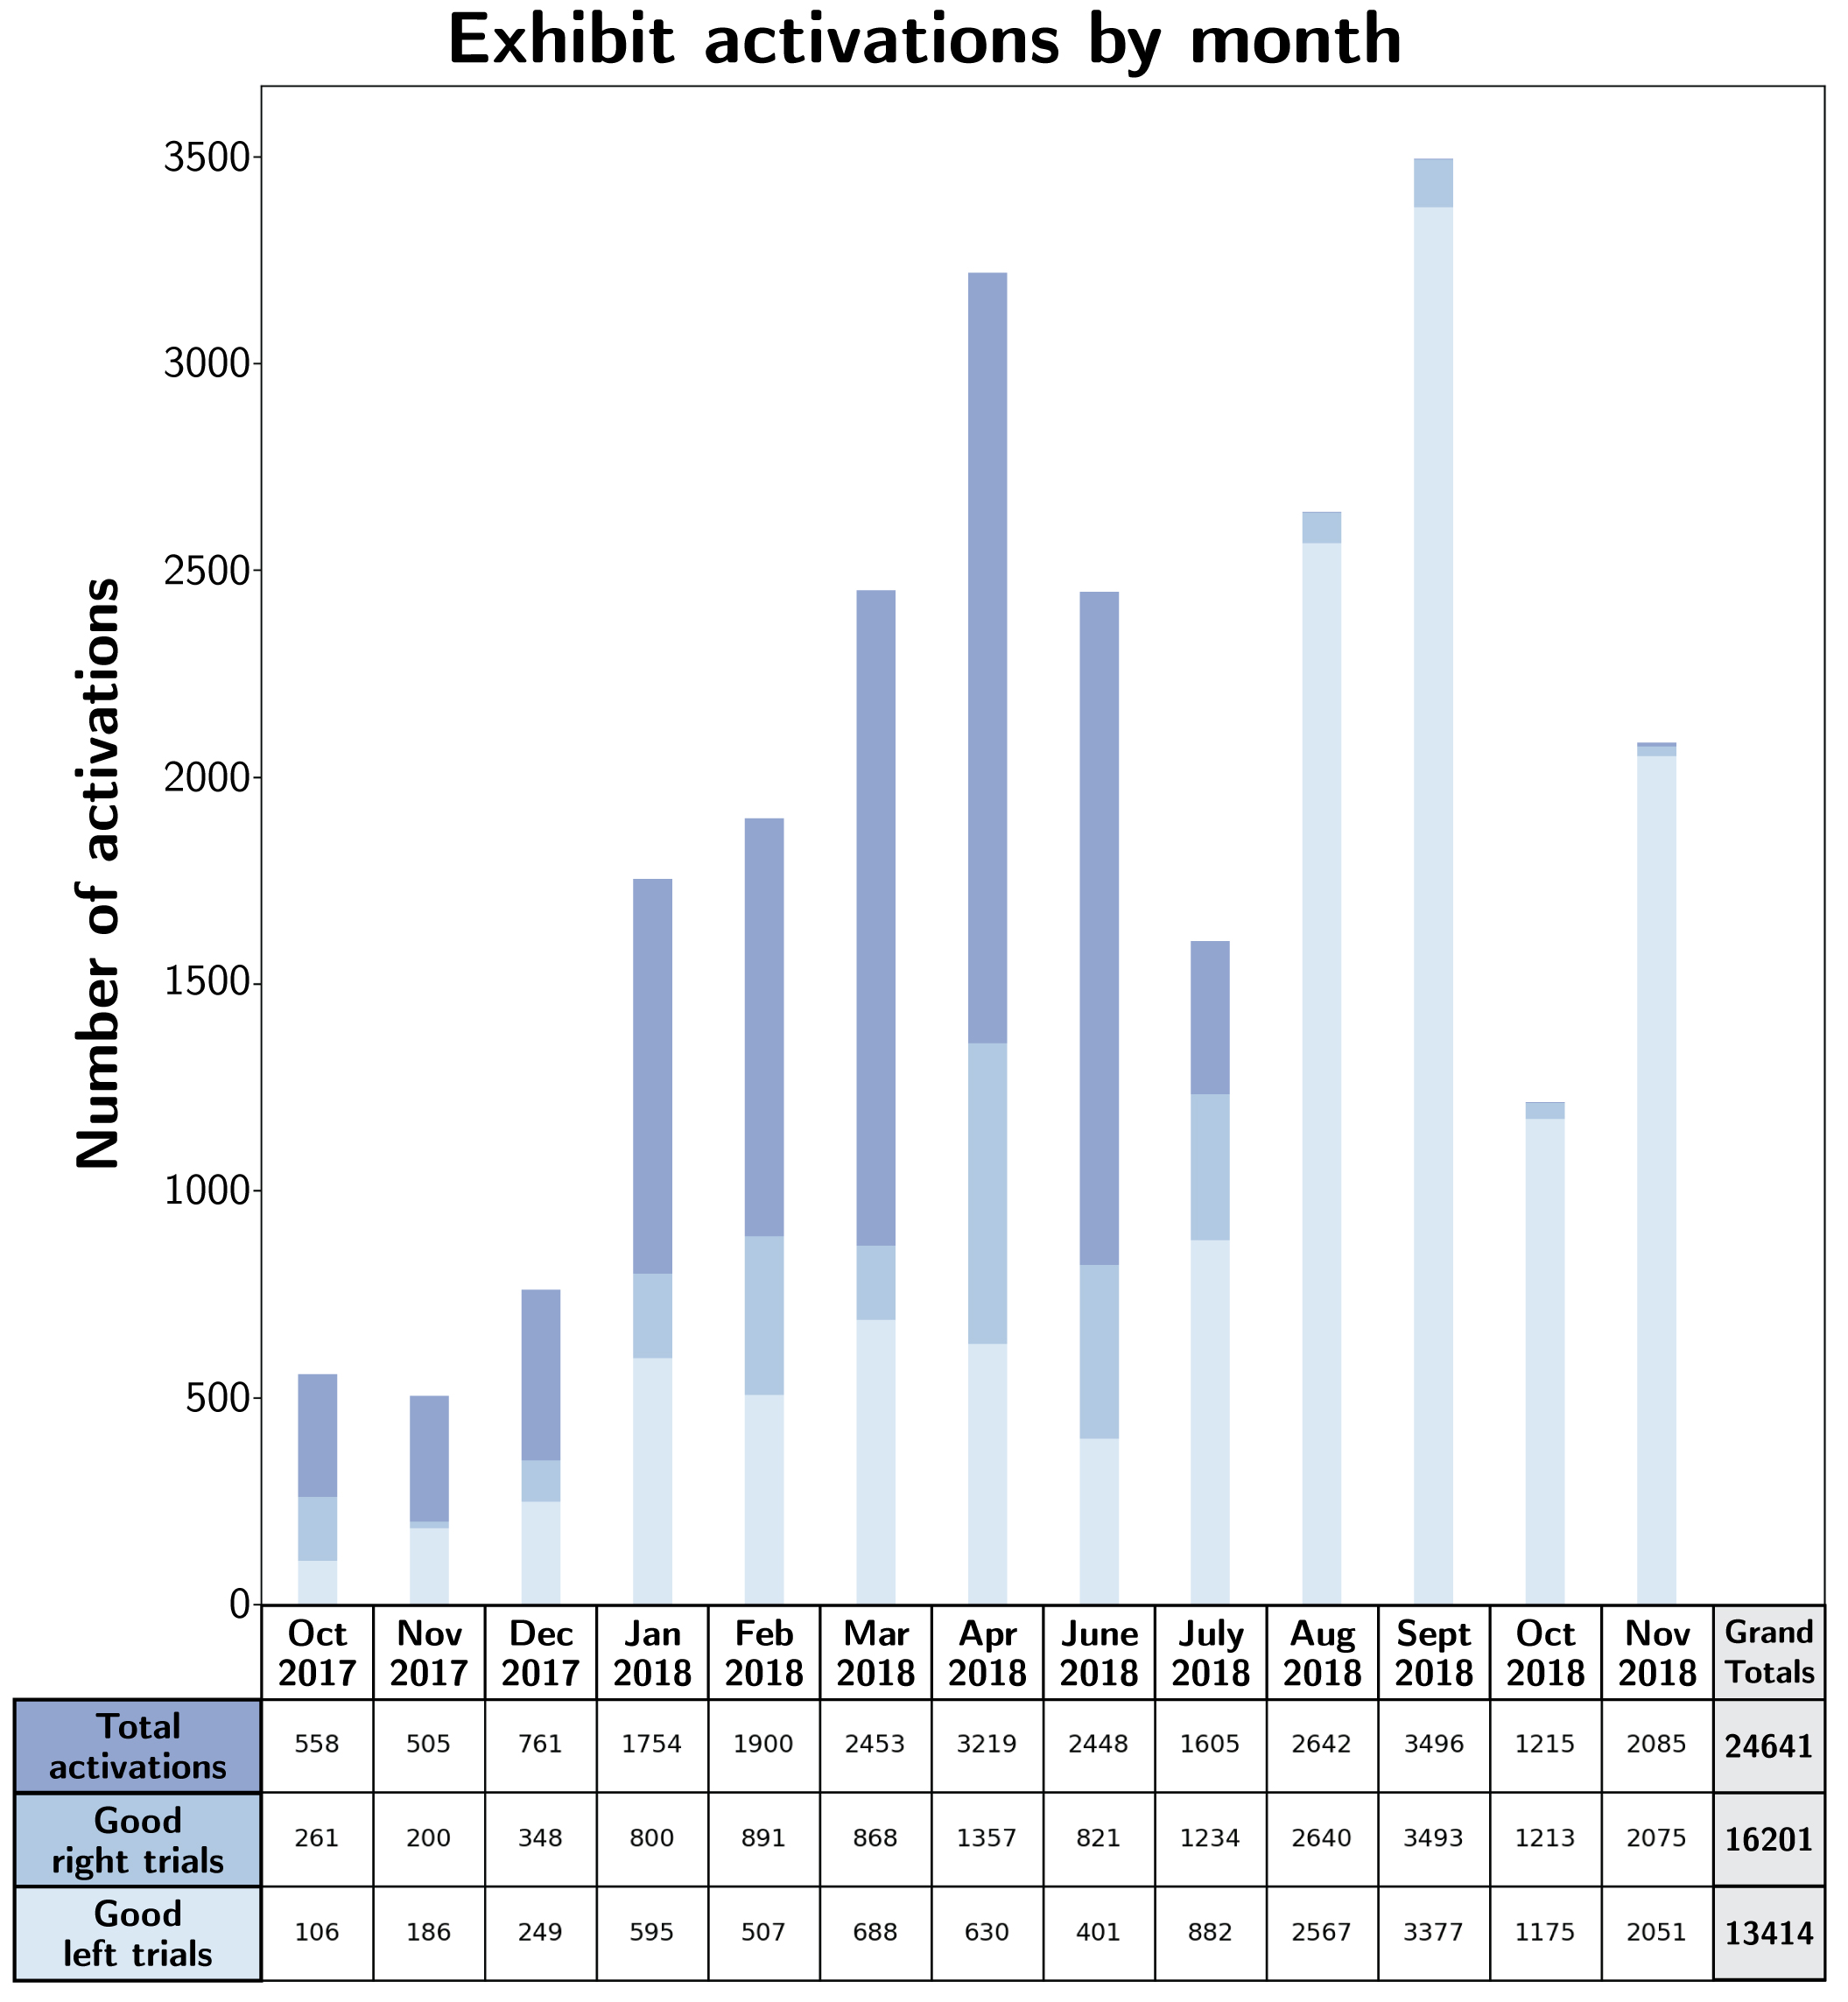
The exhibit turned out to be extremely popular. During the first month of automated data collection, the exhibit was activated 558 times, and by the time the exhibit had been running for a year, the exhibit had been activated a grand total of 24,641 times.

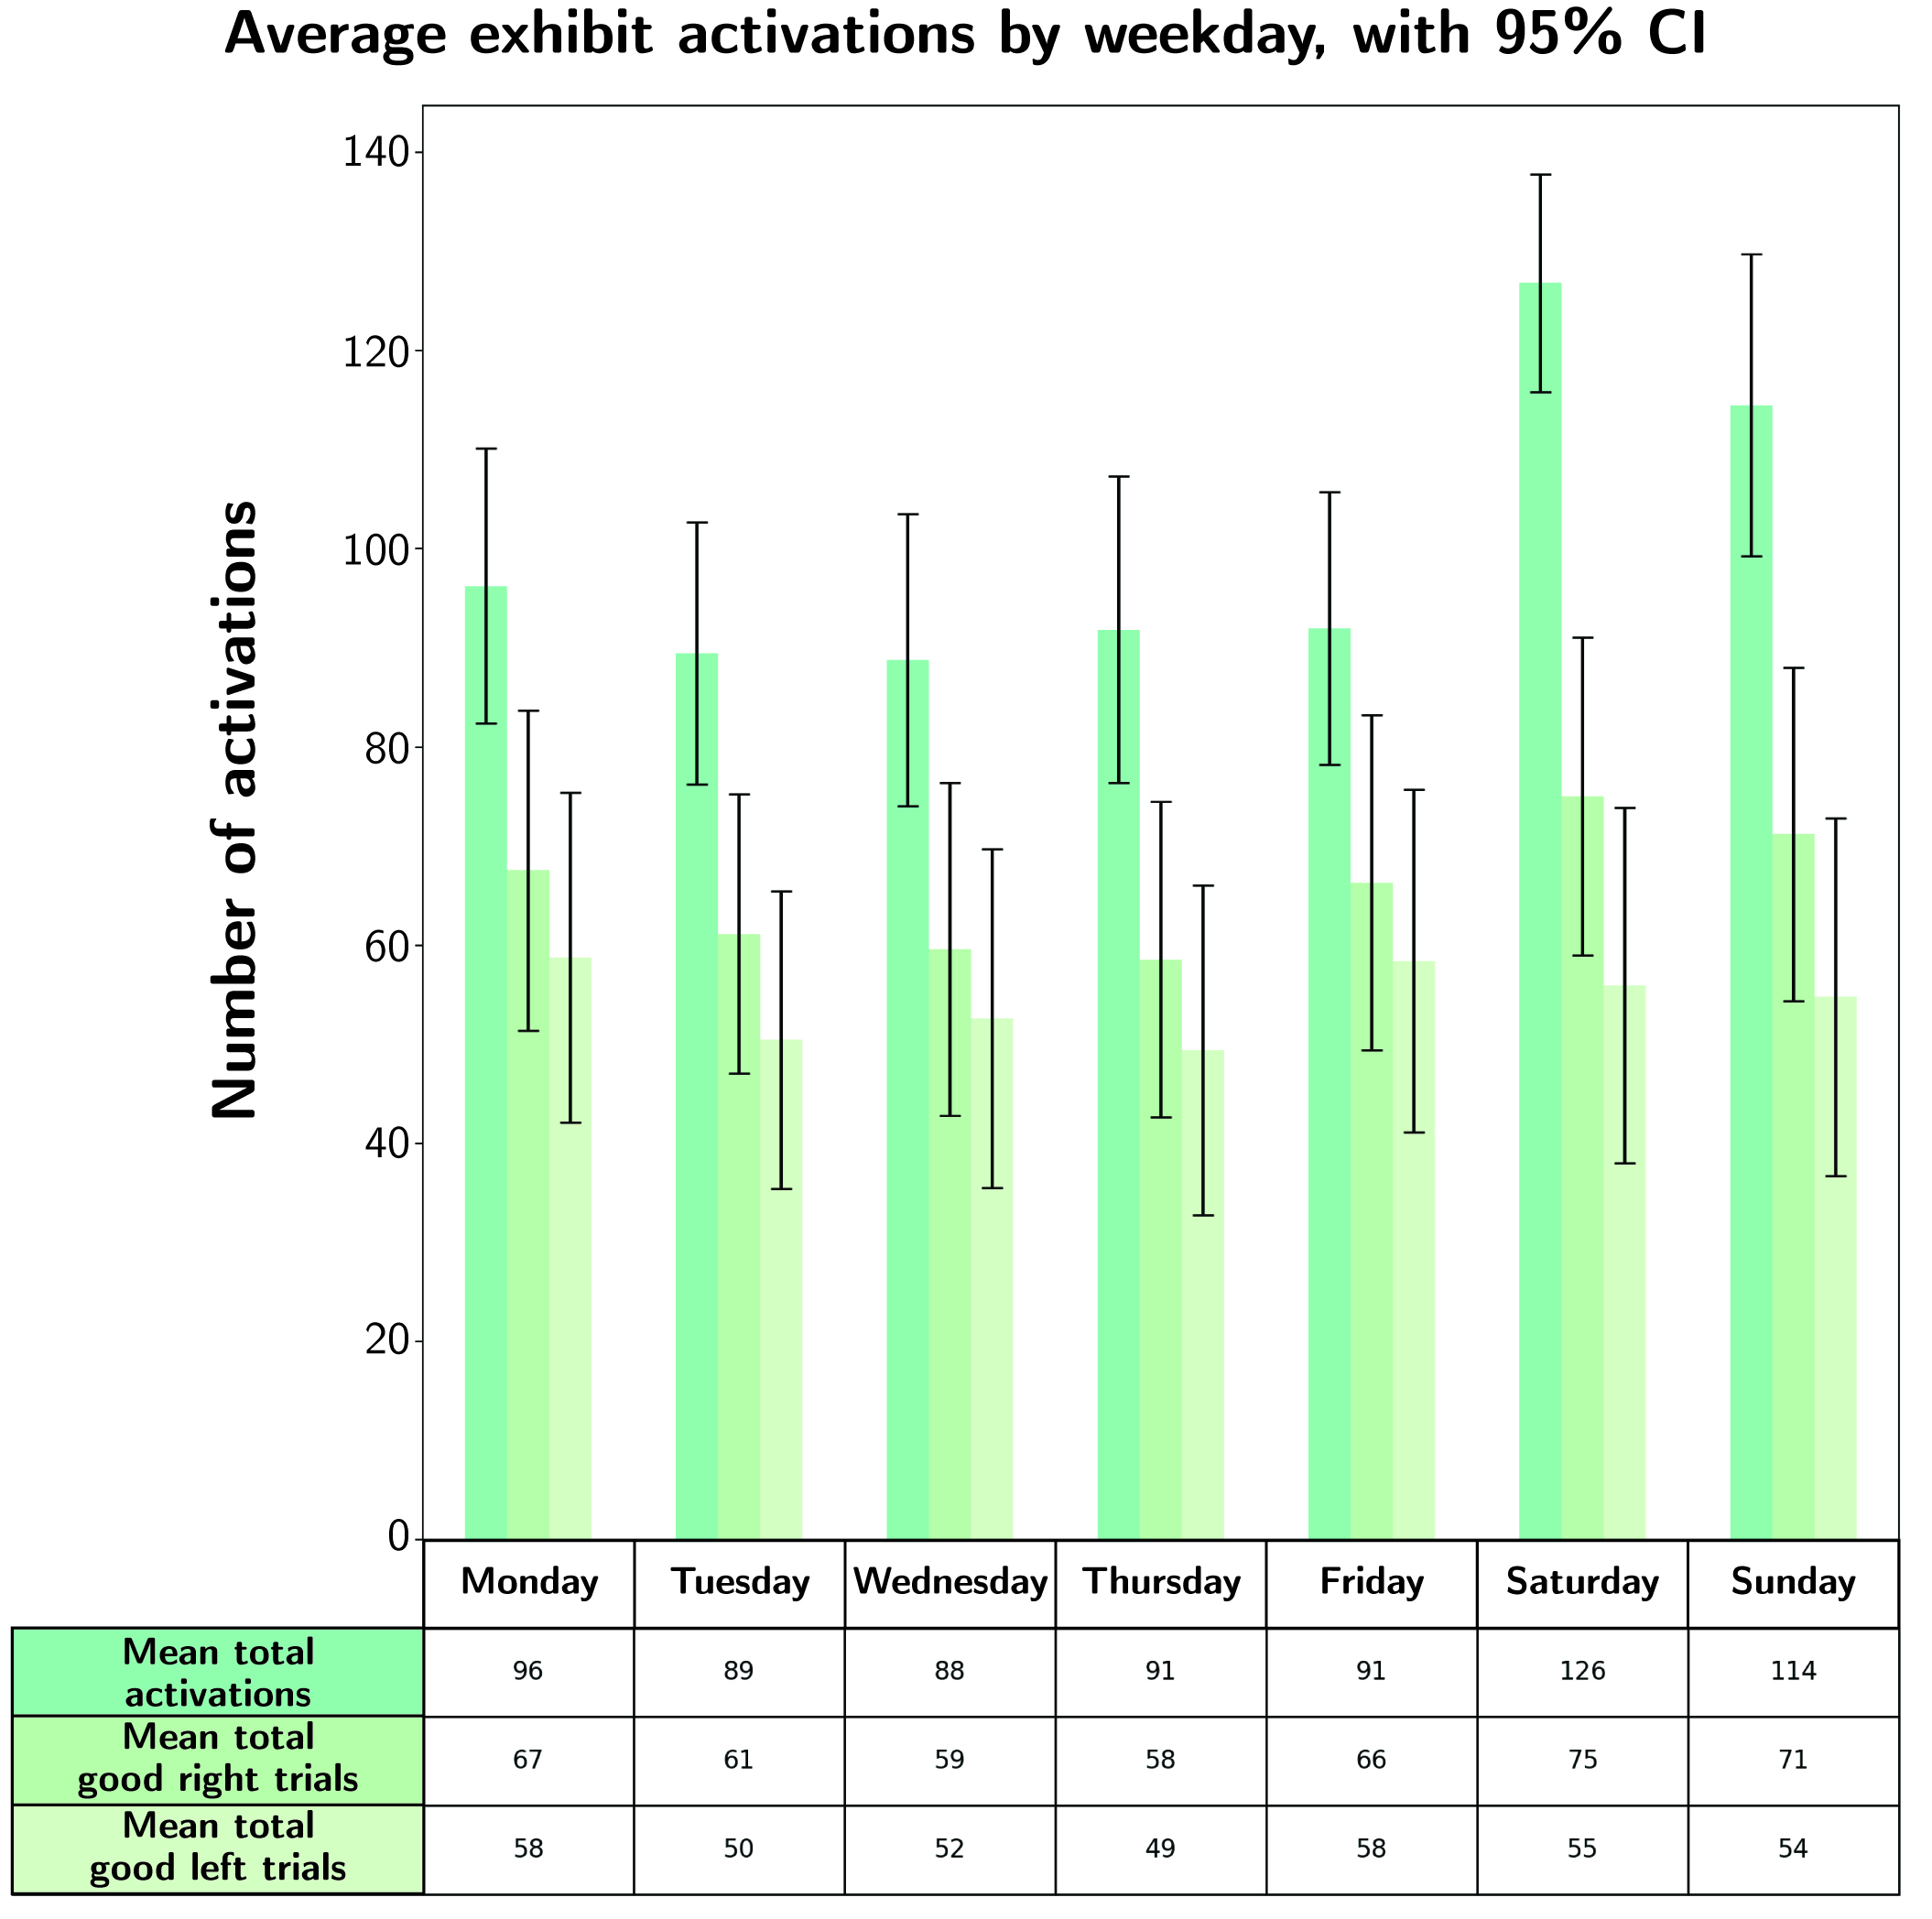
Not everyone who activated the exhibit successfully completed the experiment. In the engagement plots below, a “good trial” is defined by whether or not our analysis workflow was able to reliably find and track a pupil throughout the experiment. If a pupil was not found by our algorithm for a stretch of 100 consecutive frames or longer, the entire trial was thrown out.

Exhibit activations and visitor engagement, sorted by month
Fig. 5: Number of exhibit activations sorted by month. A single ‘activation’ refers to an instance of someone pressing a language button on the front panel of the exhibit to initiate an interaction. If a pupil was not found by our algorithm for a stretch of 800 milliseconds or longer, the entire trial was thrown out; remaining trials were deemed ‘good trials’. One major maintenance session was required on 02 May 2018; other than that, the exhibit ran autonomously for 13 consecutive months while collecting data.
Exhibit activations and visitor engagement, sorted by weekday
Fig. 6: Number of exhibit activations sorted by weekday.

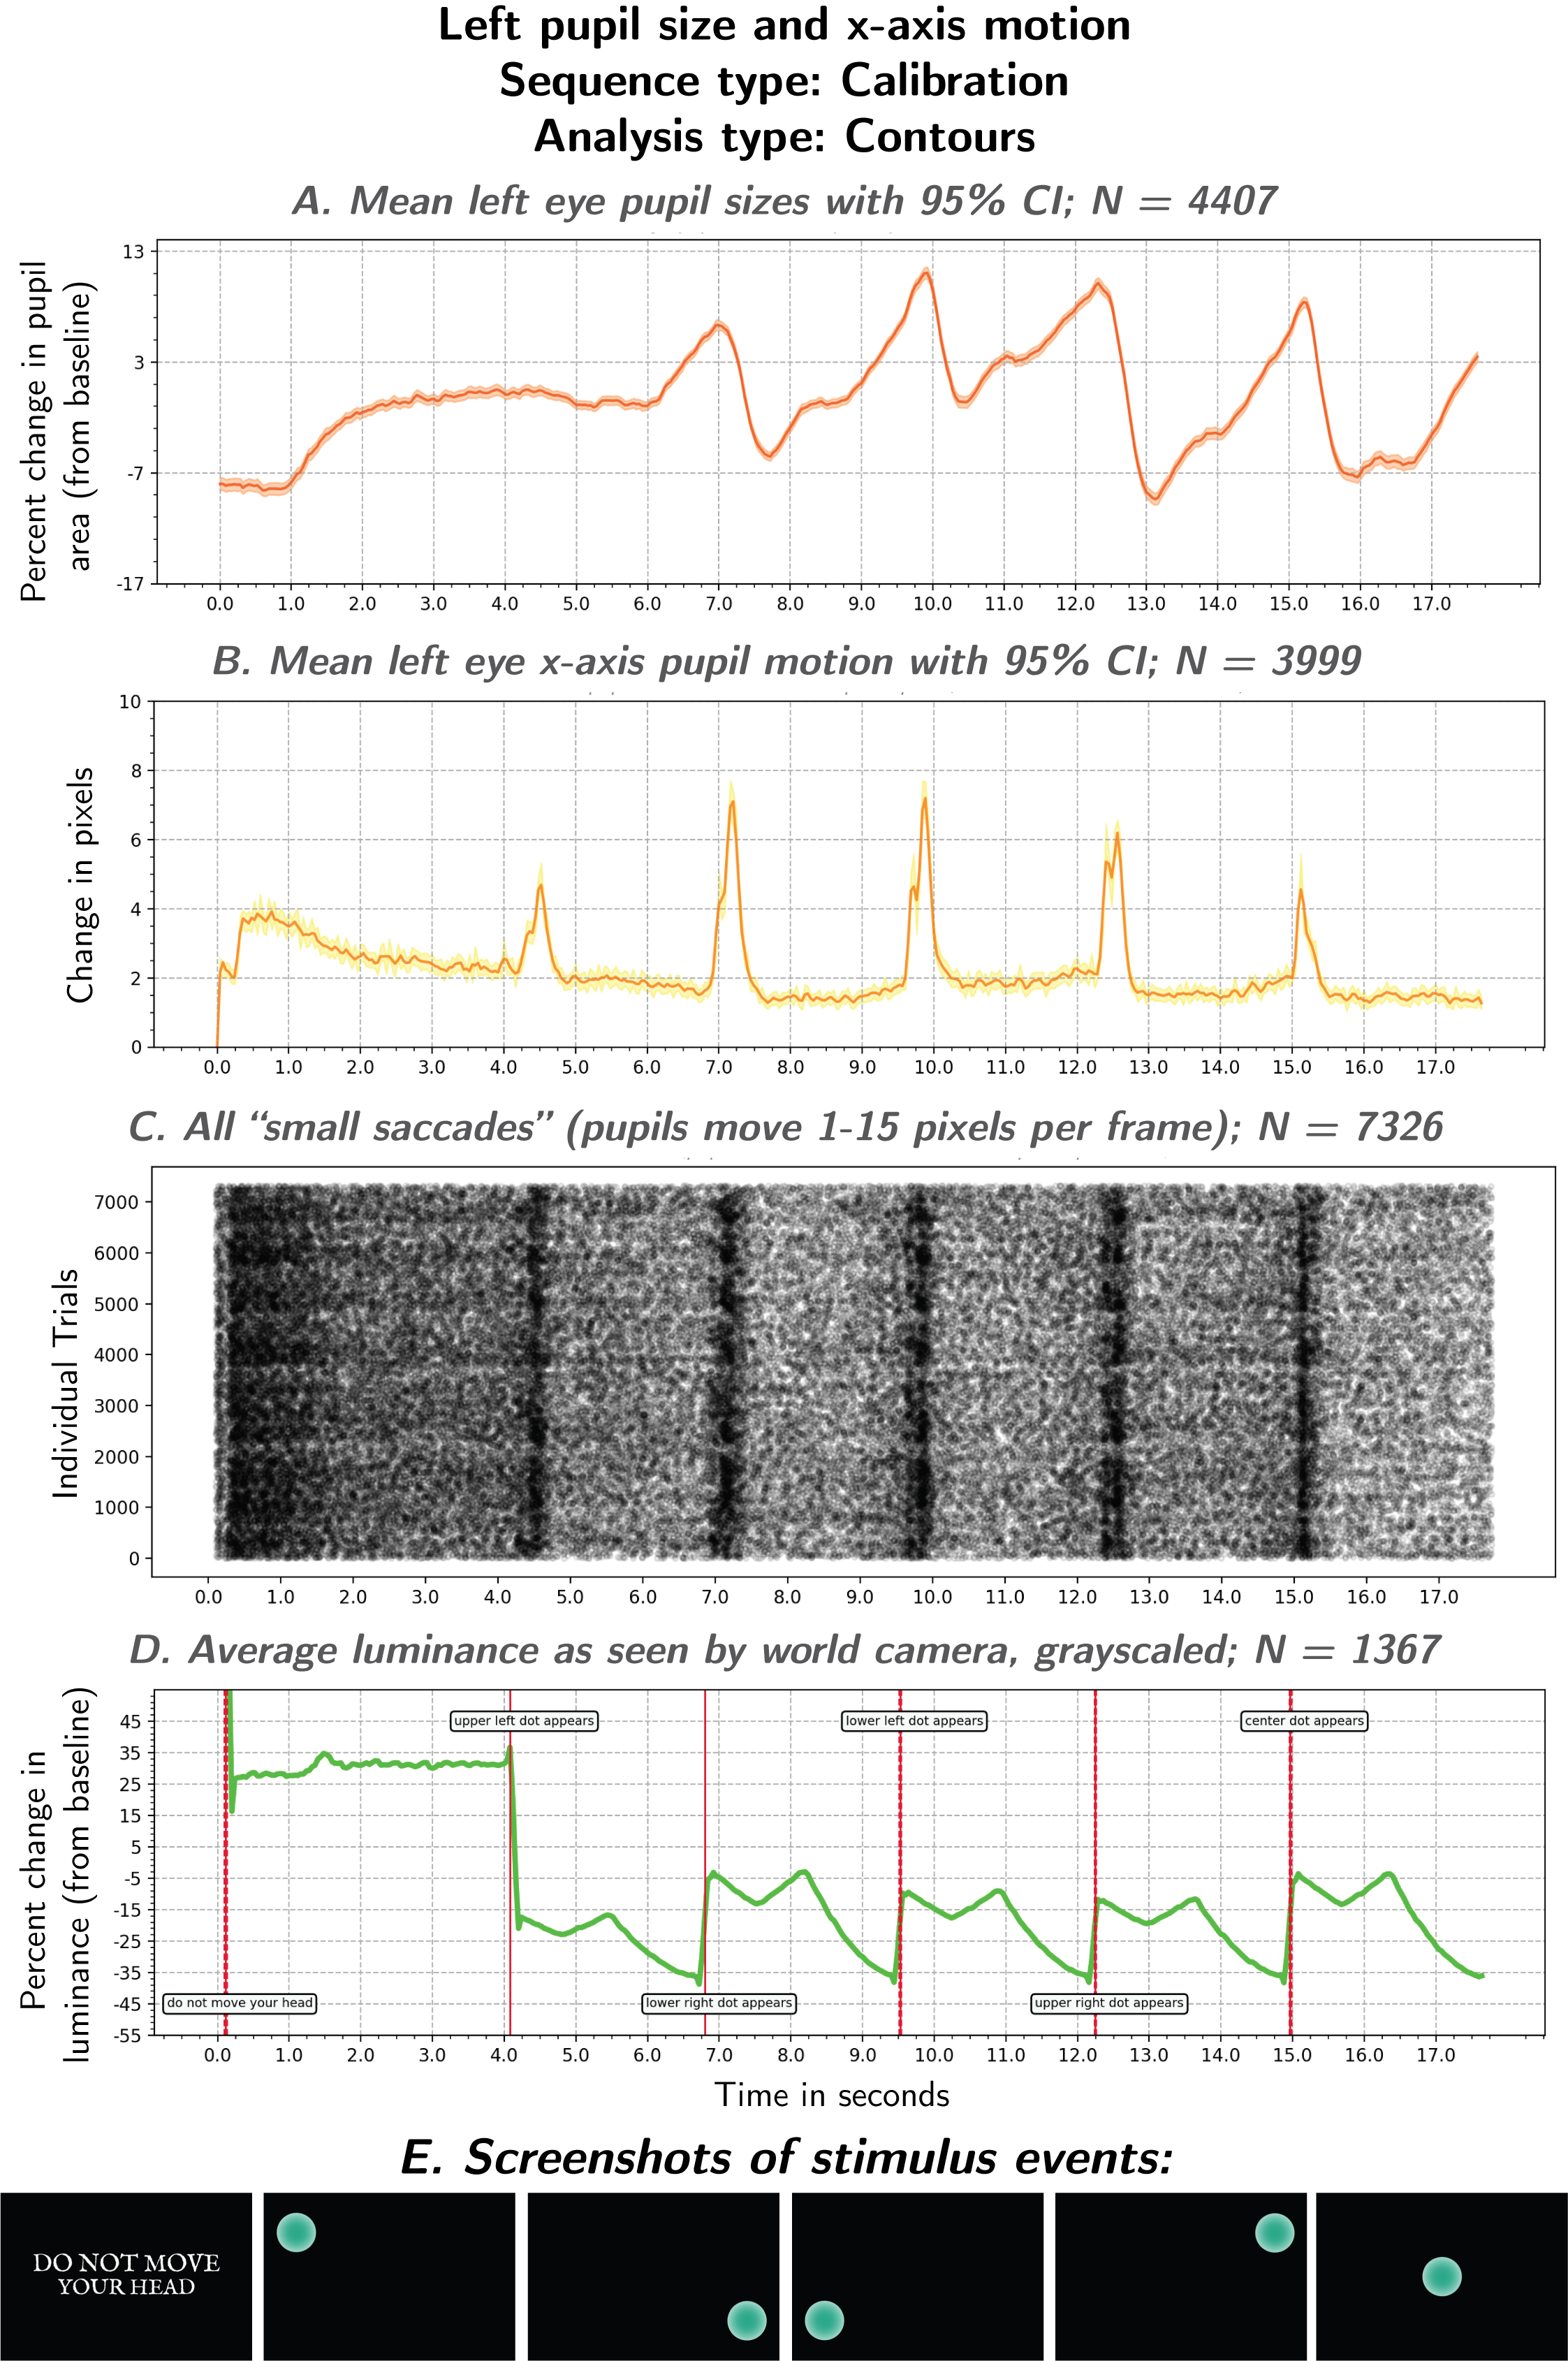
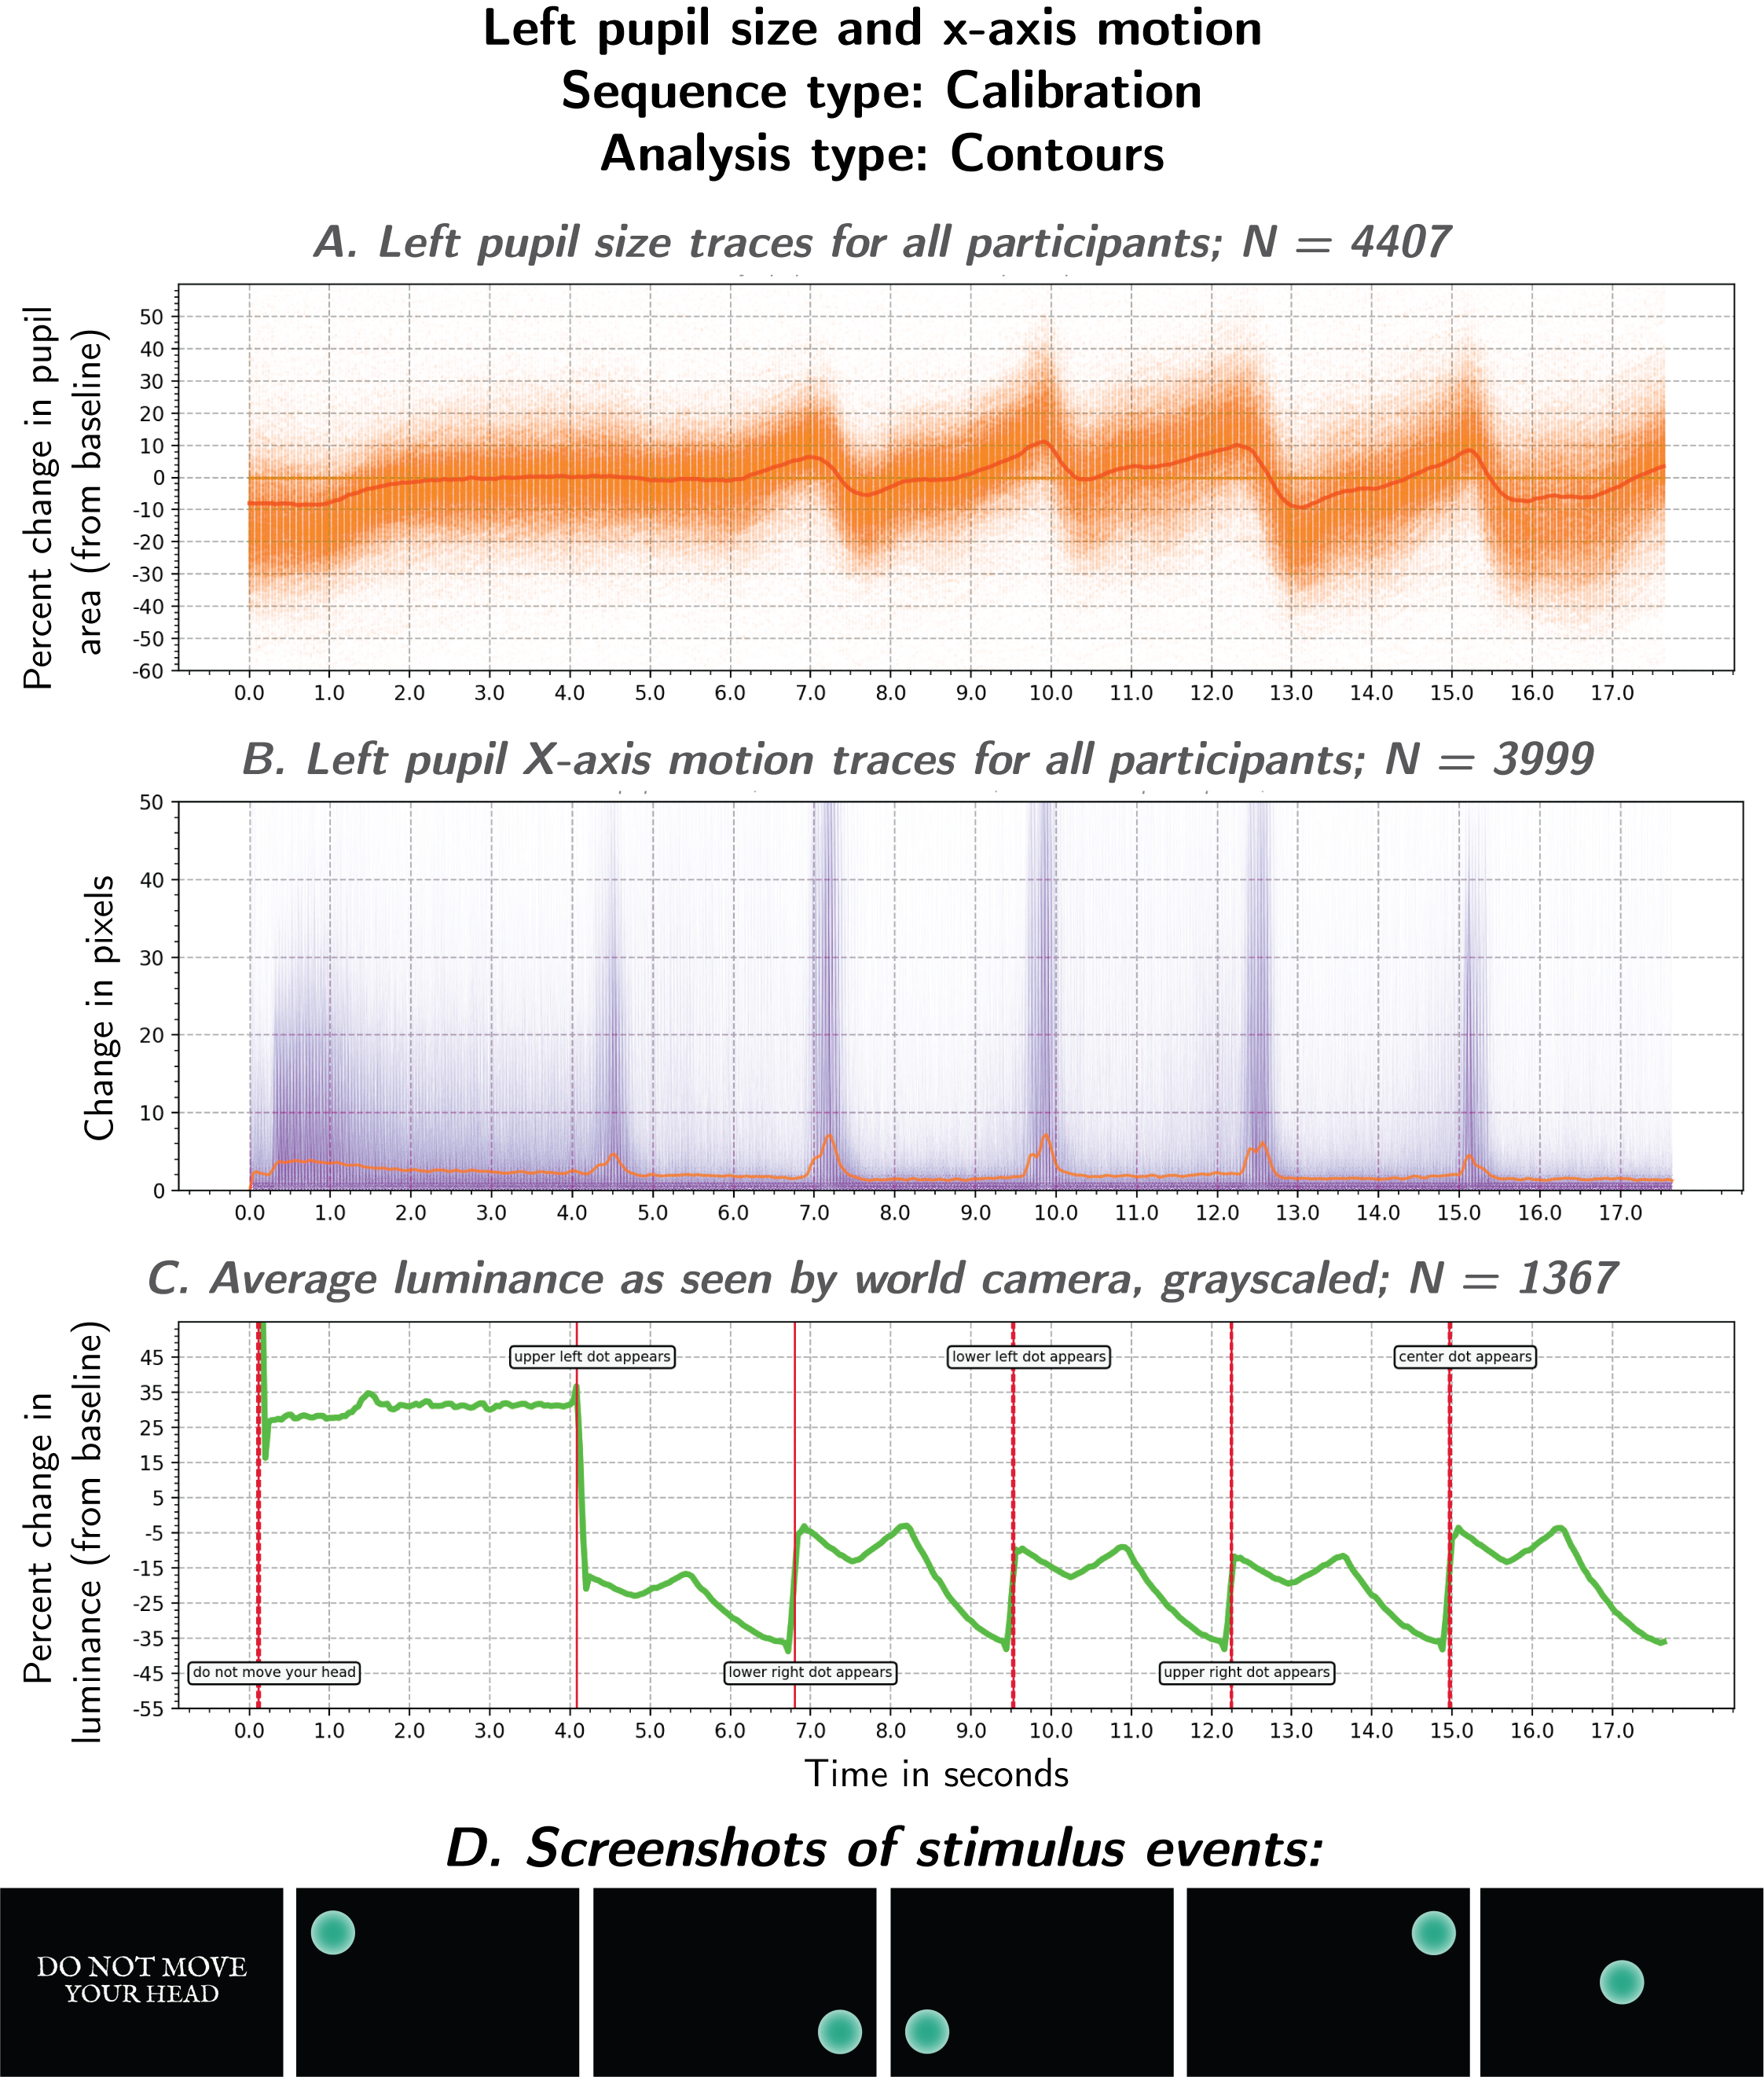
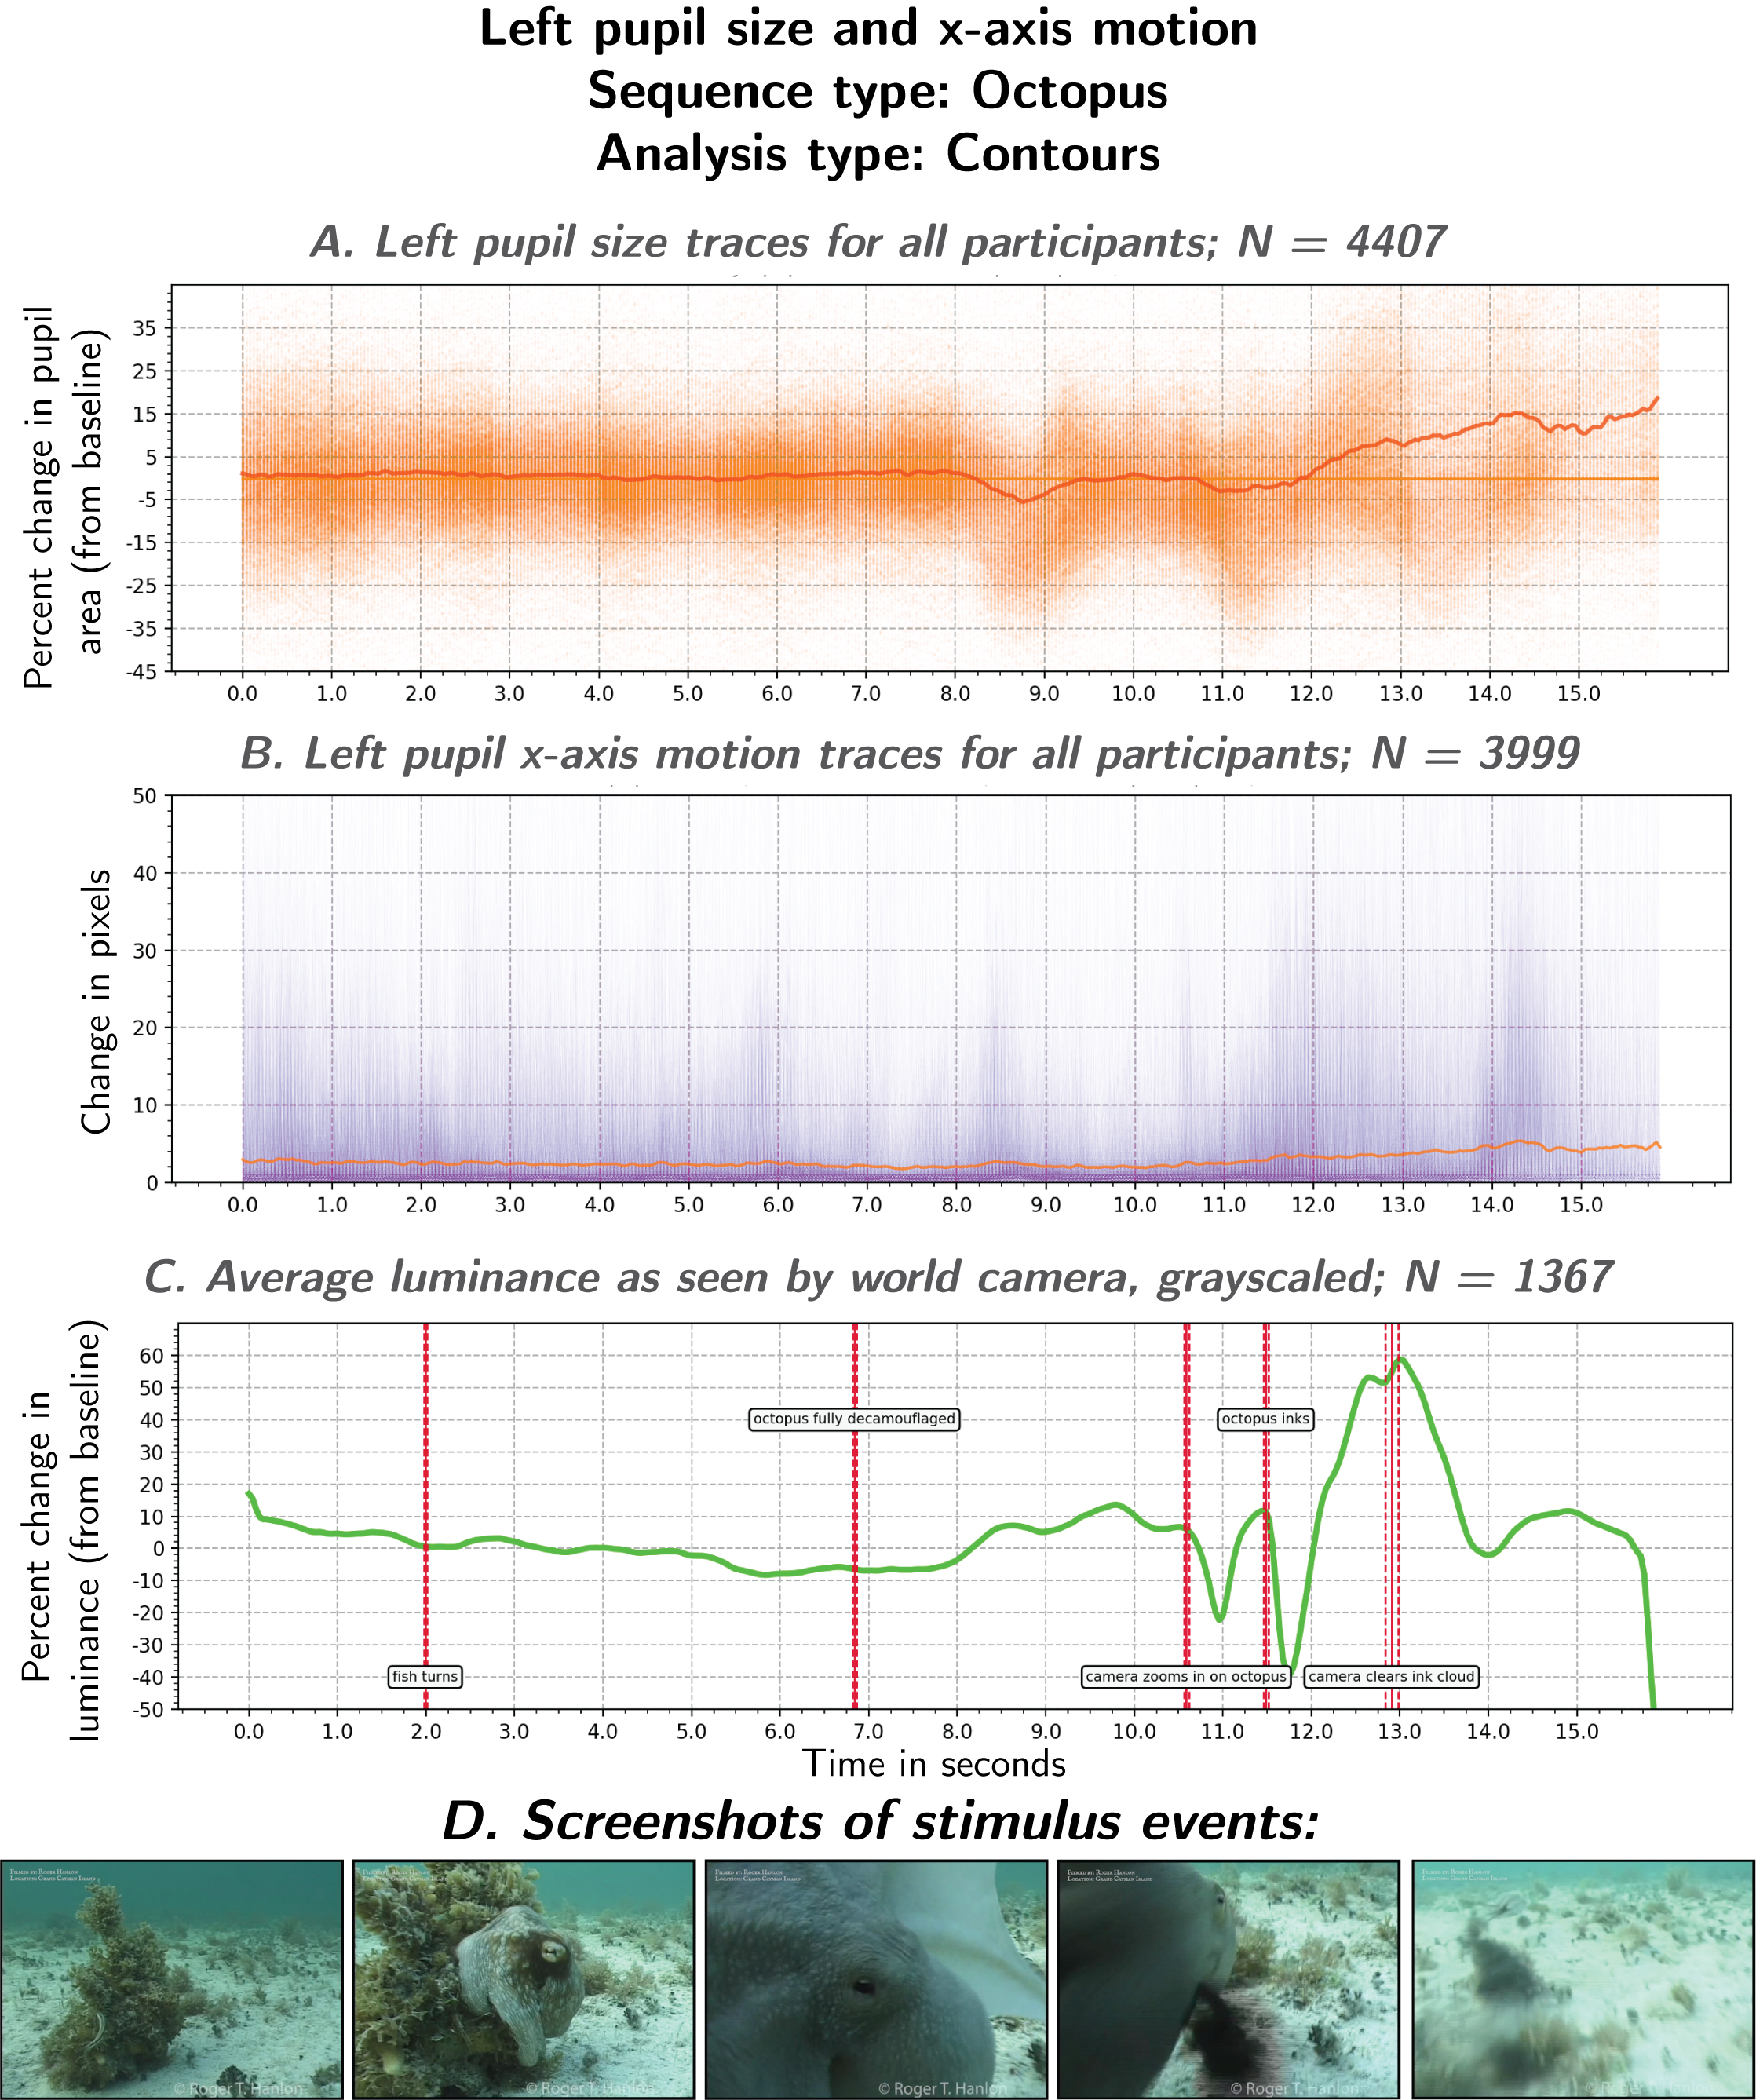
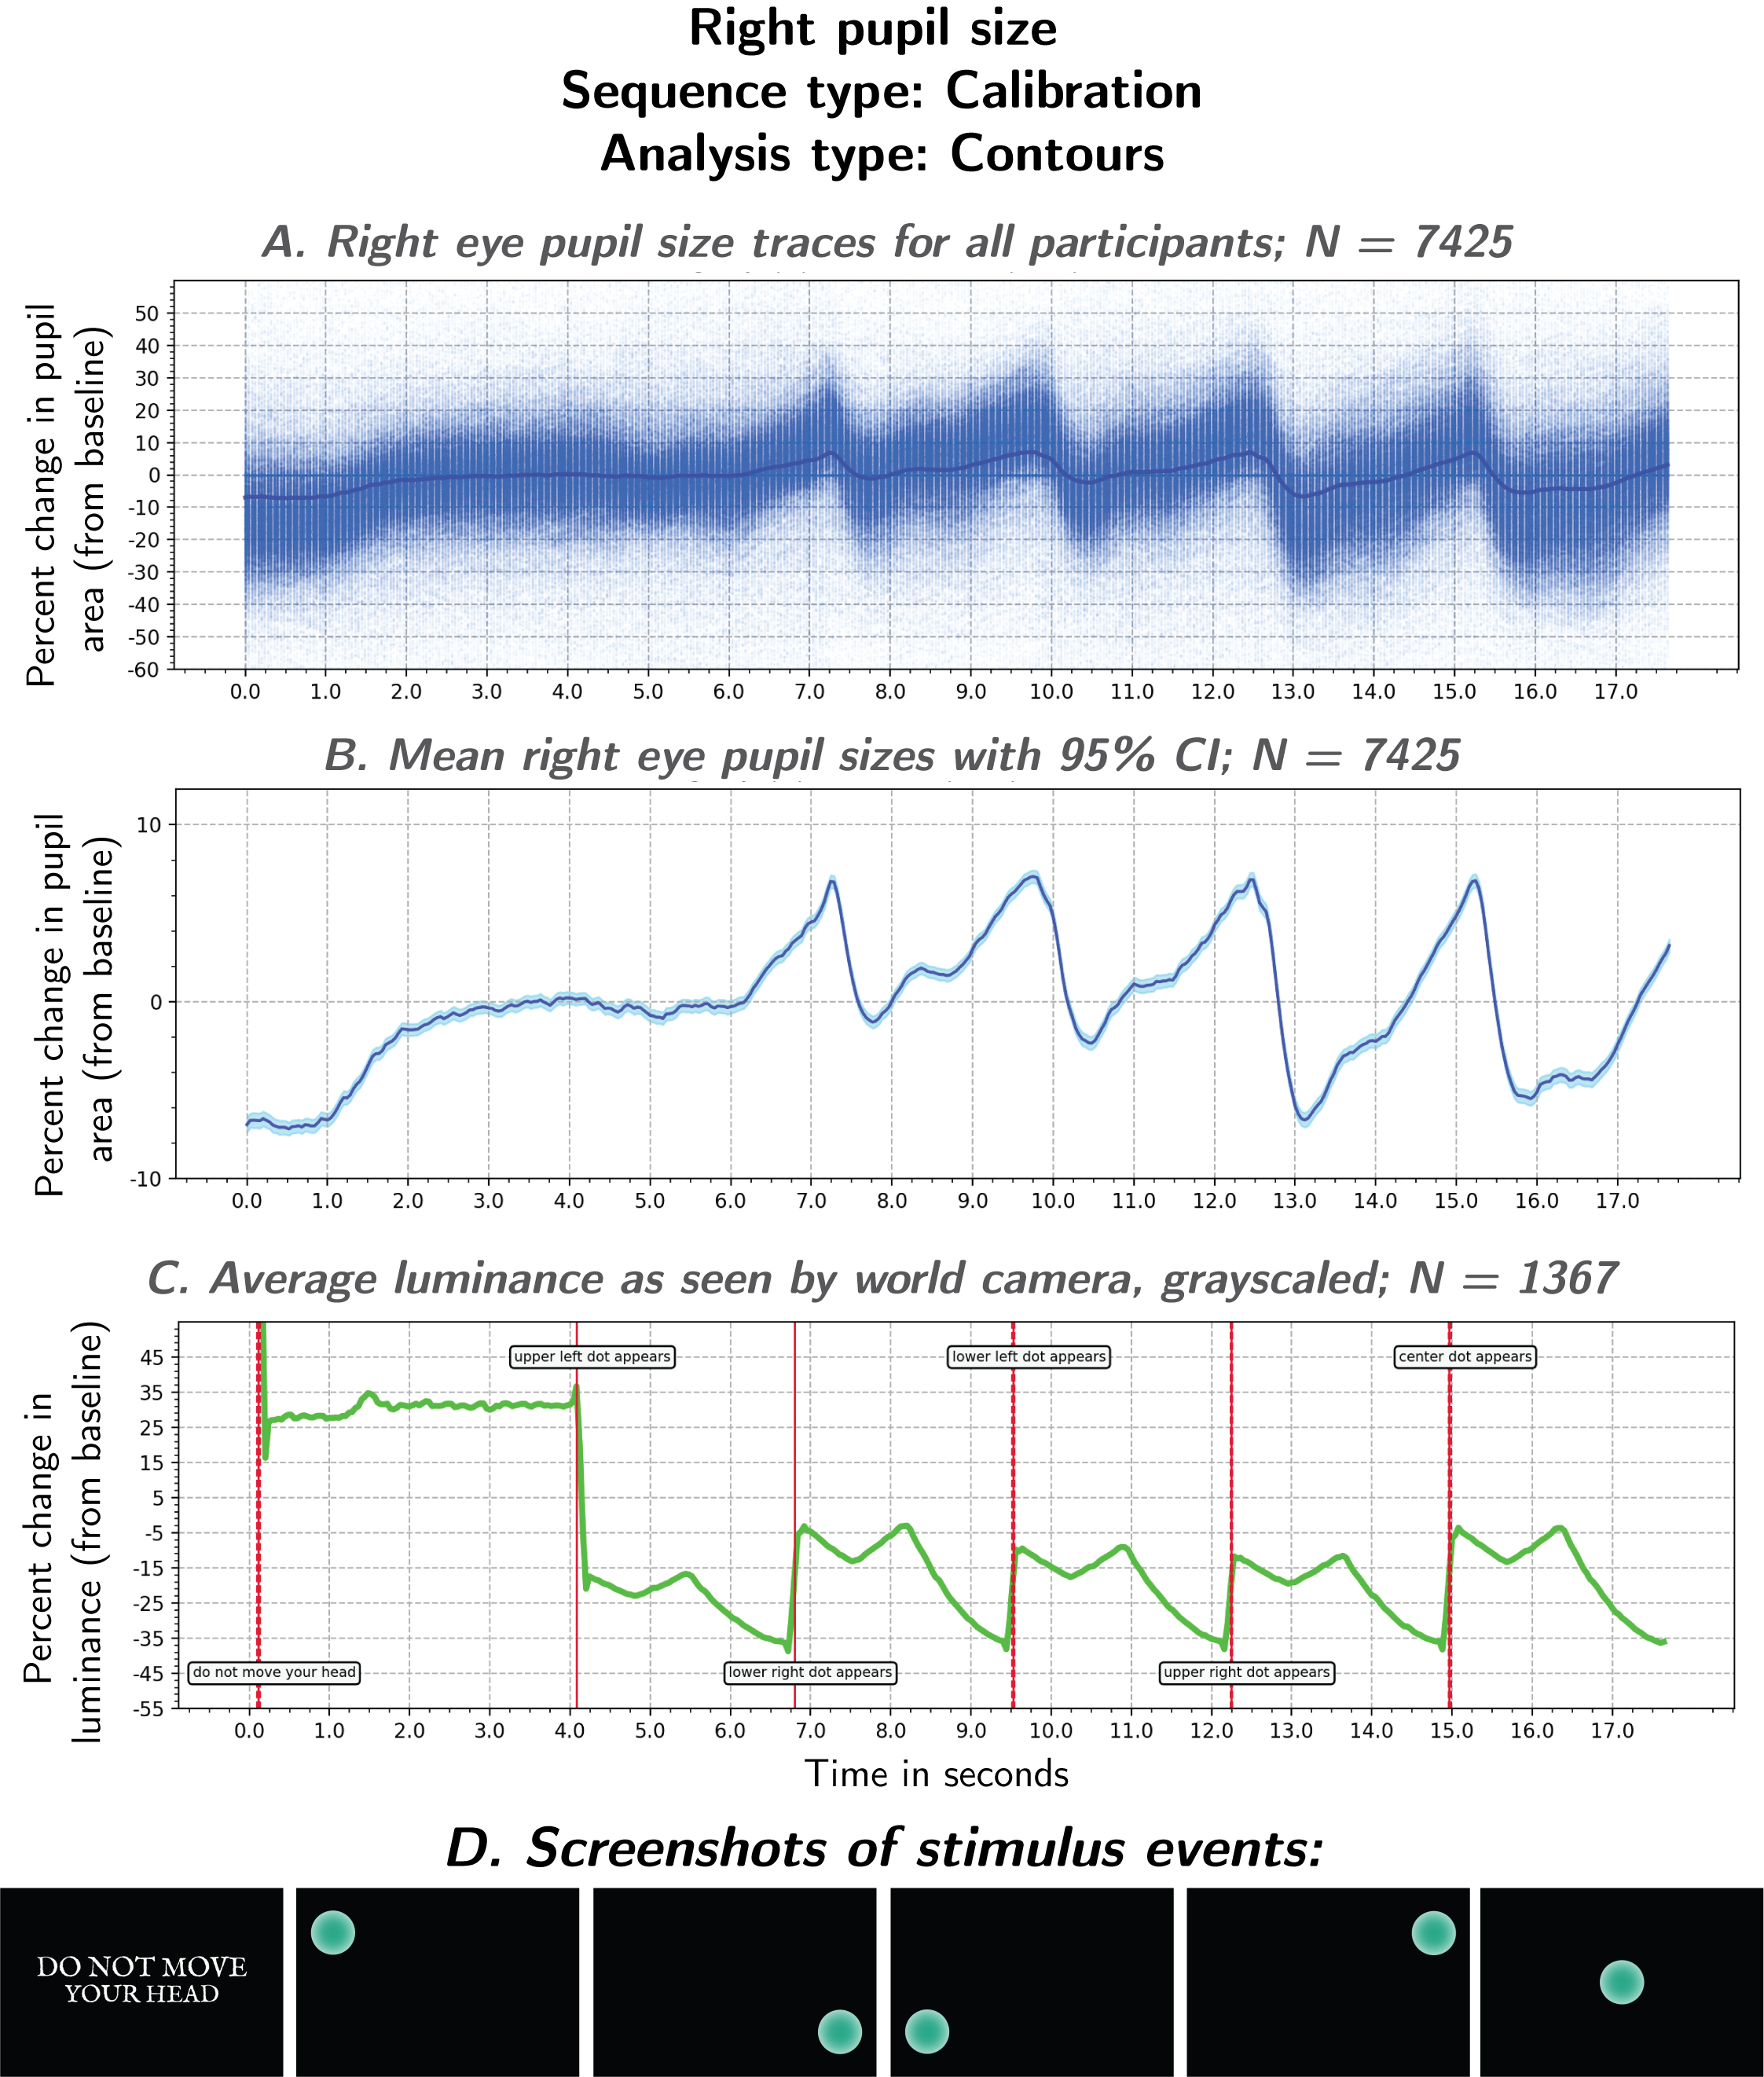
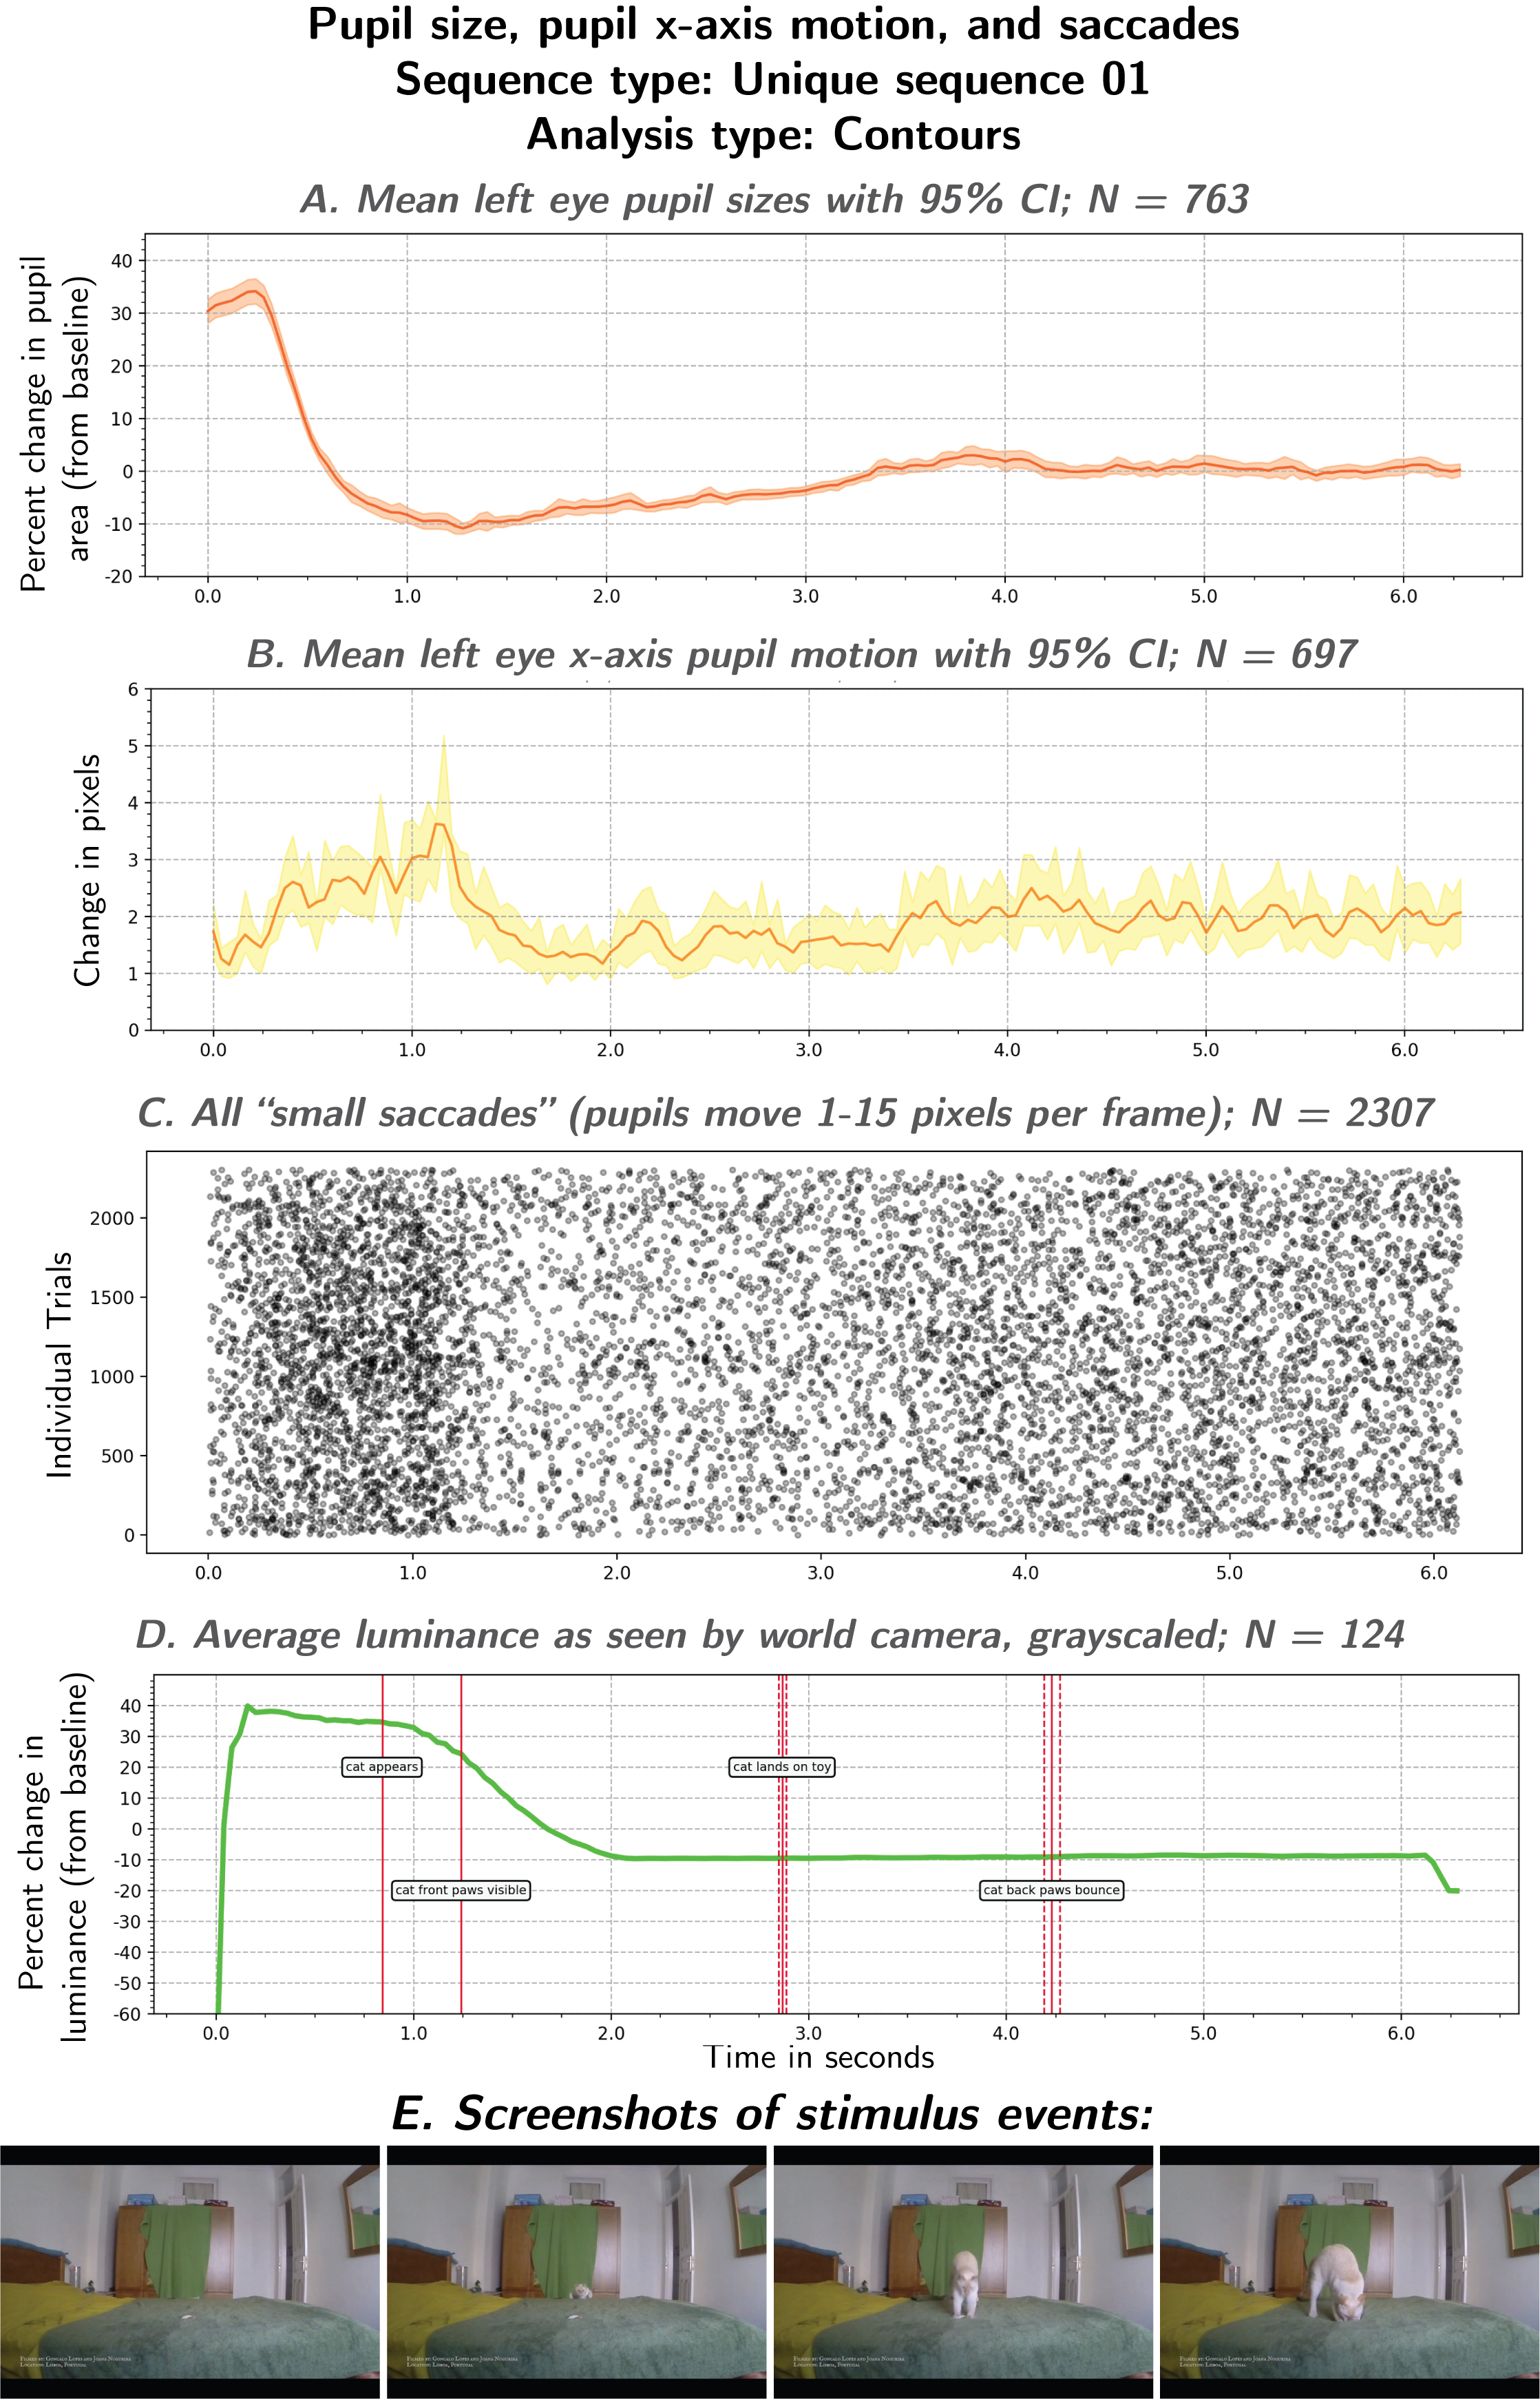
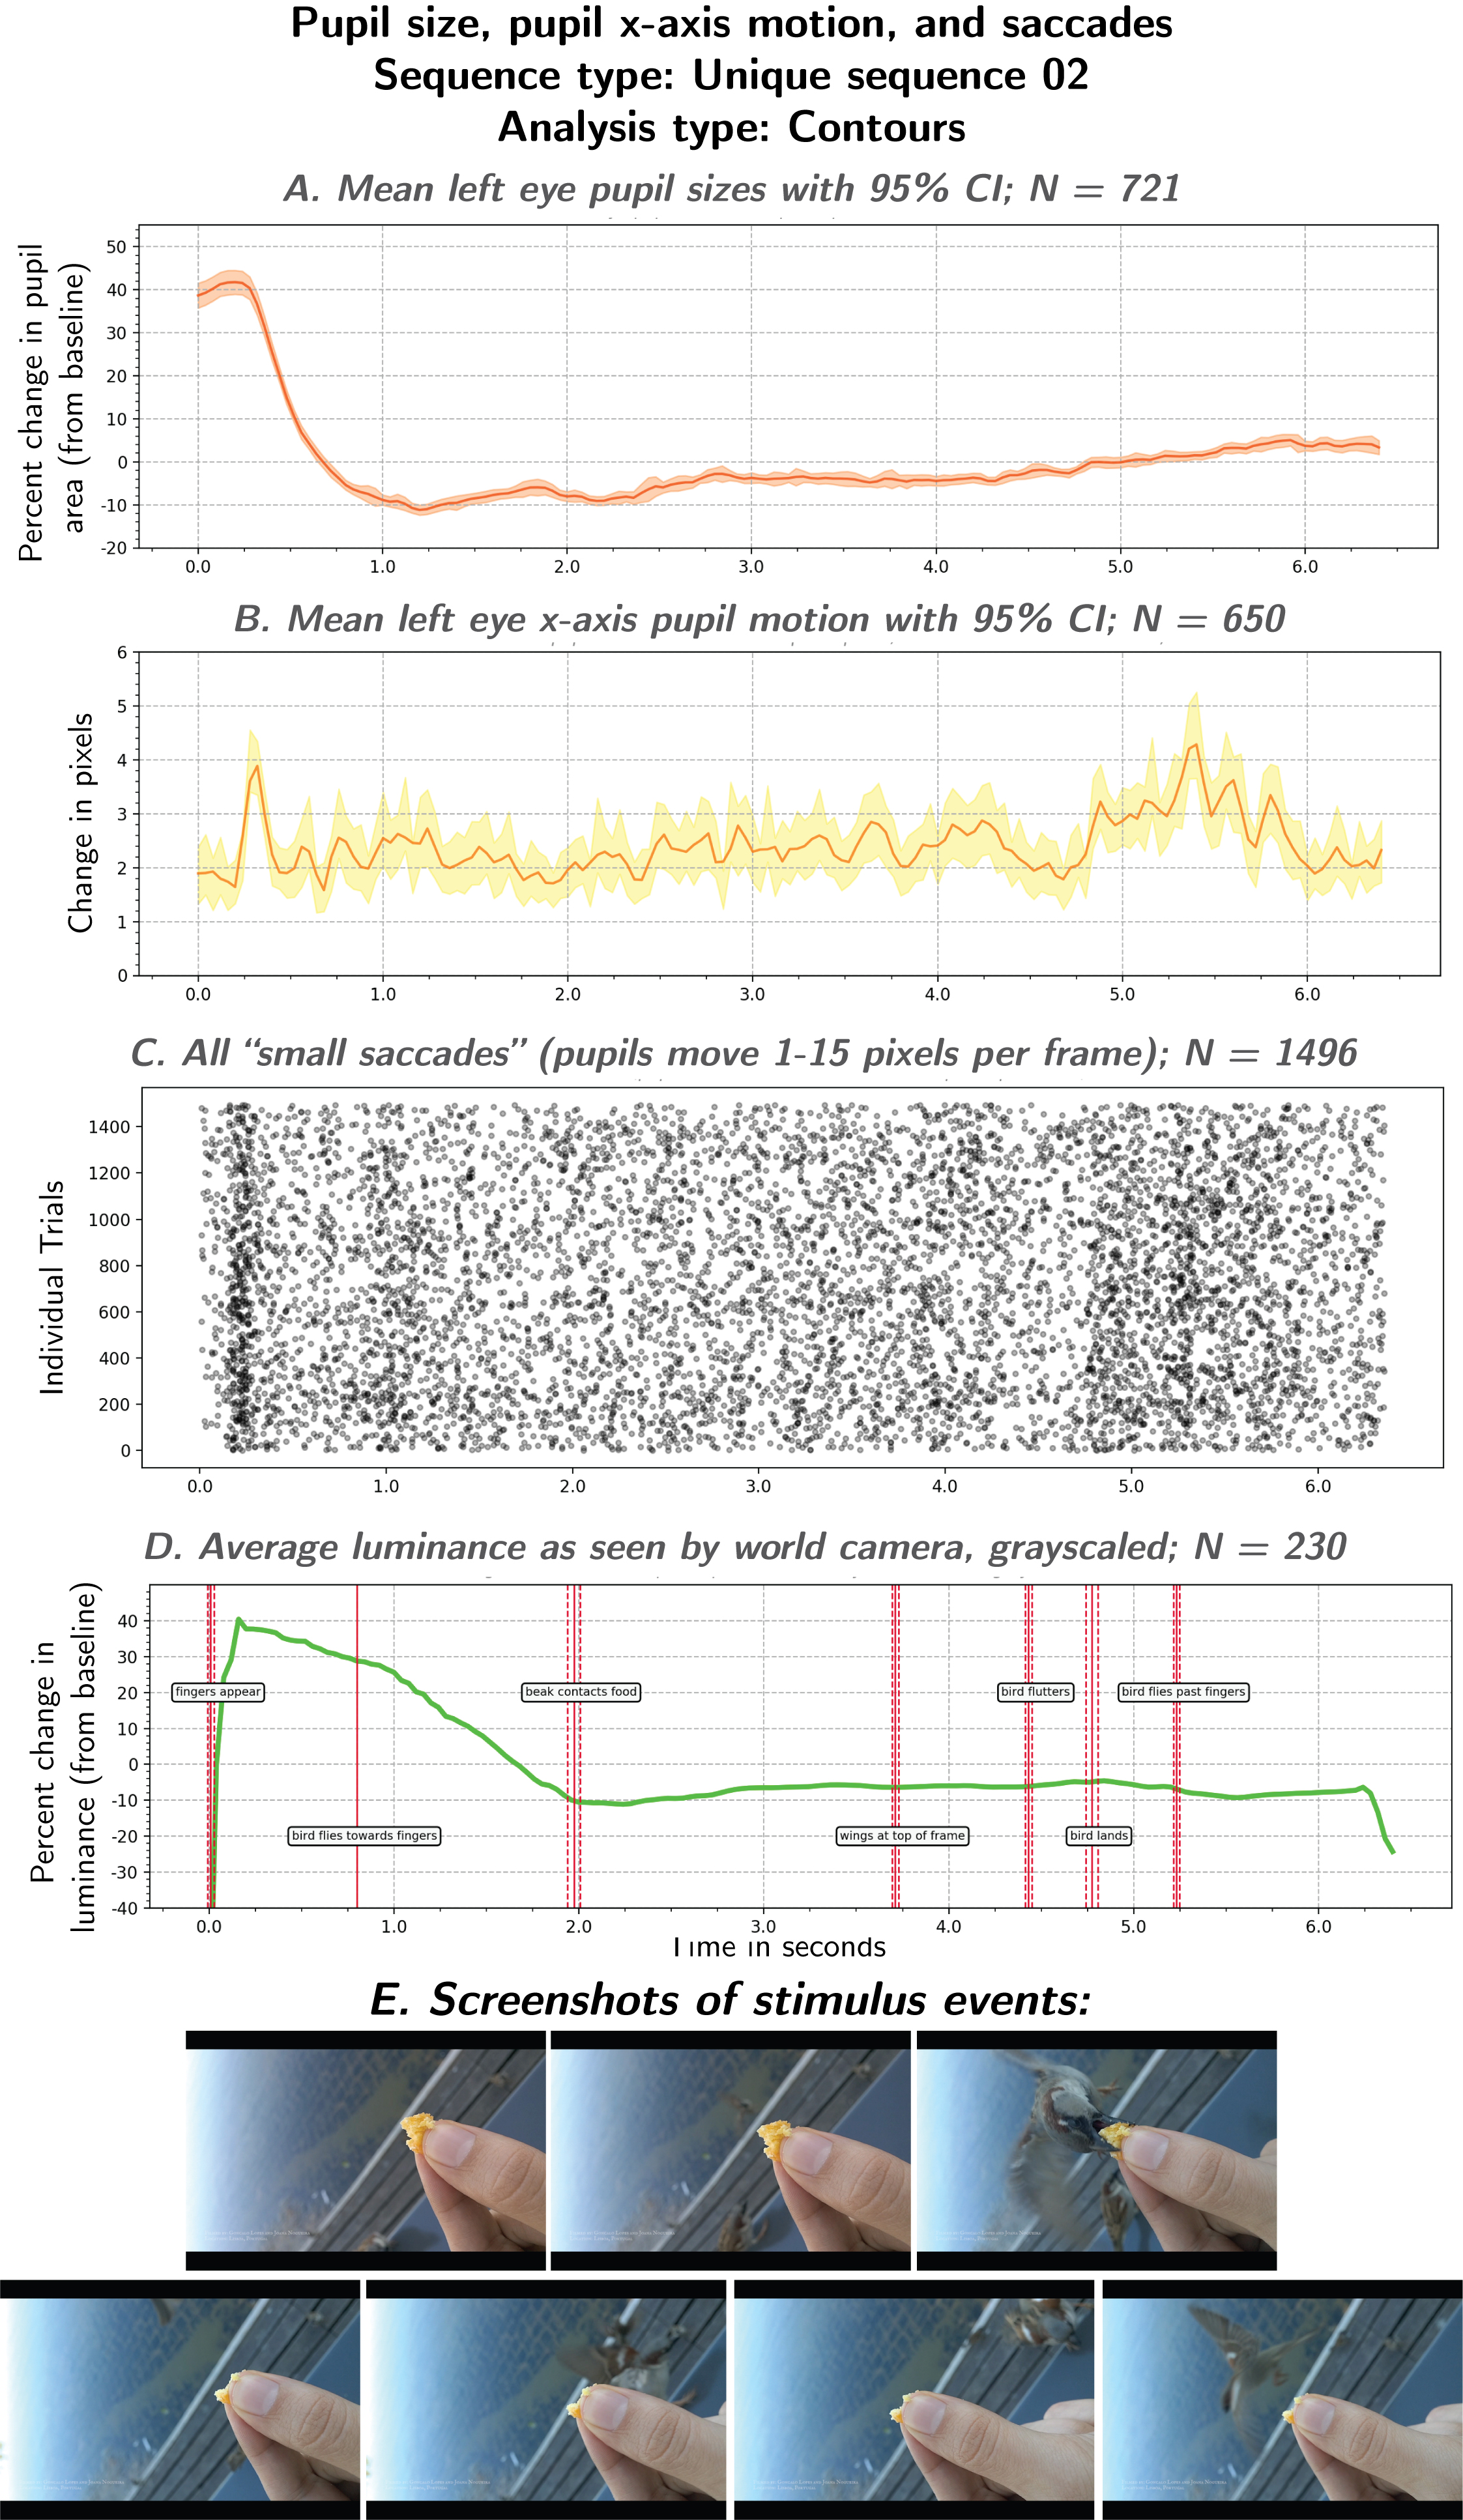
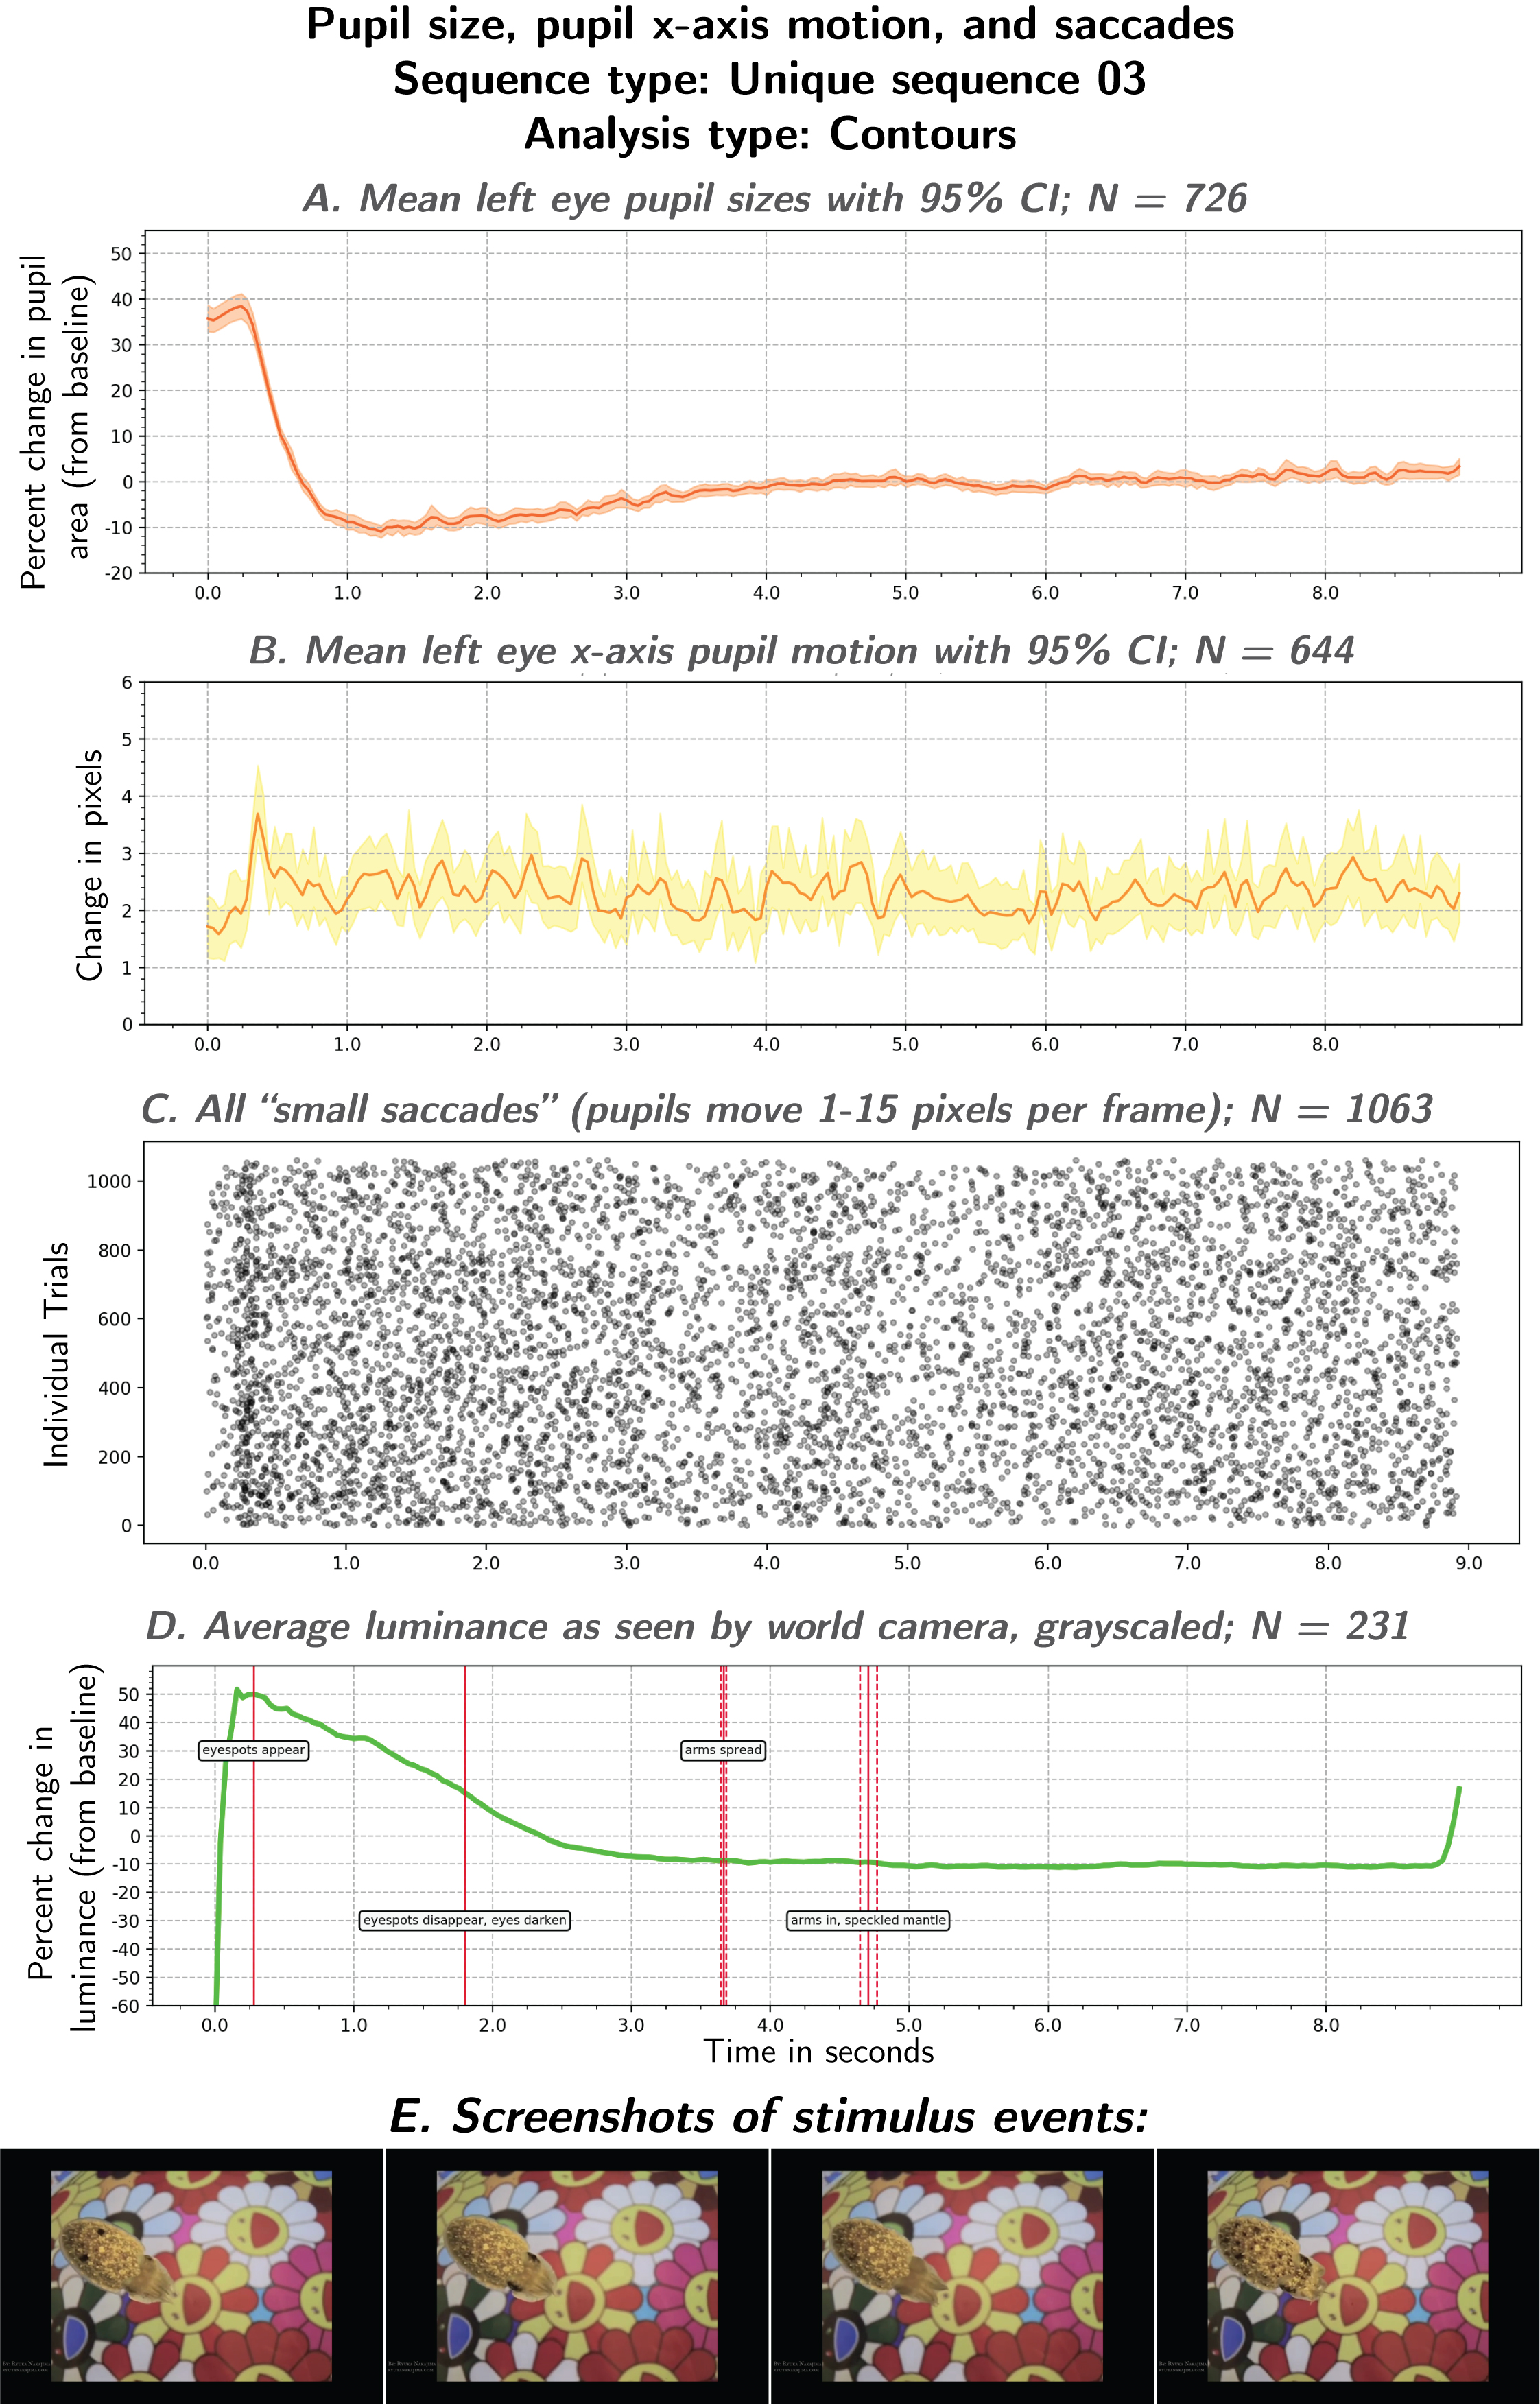
As shown in figure 3, each participant watched a calibration sequence, a unique video clip, and then a video clip of an octopus rapidly de-camouflaging. You can watch all six possible video experiences by scrolling to the bottom of this page, or by visiting the Surprising Minds Stimuli YouTube playlist.

Because the calibration sequence and octopus clip was experienced by all participants, we pooled calculations of changes in pupil size and motion across all “good trials” obtained for these sequences. The plots below show pupil size and motion from all the good trials obtained with the left eye camera (N=4407).

Left pupil size and x-axis motion during calibration sequence
Fig. 7: Using the calibration sequence to benchmark the experiment setup. A. Mean left pupil size with 95% confidence interval. B. Mean left pupil motion in x-axis, with 95% confidence interval. C. Raster of ‘small saccades’, pooled to reveal moments when many people made saccades during the same moment of the stimulus video. D. Average luminance of stimulus, as seen by the world camera (see Fig. 2). E. Screenshots of stimulus events labeled in subplot D.
Left pupil size and x-axis motion during octopus sequence
Fig. 8: The very large sample size of this study allows us to use a traditionally noisy measure (saccade times) to measure a useful behavioral metric (‘salience’ or ‘surprise’) by pooling data across the entire study population. A. Mean pupil size with 95% confidence interval. B. Mean pupil motion in x-axis, with 95% confidence interval. C. Raster of ‘small saccades’, pooled to reveal moments when many people make saccades during the same moment of the stimulus video. D. Average luminance of stimulus, as seen by the world camera (see Fig. 2)

Supplemental Materials

Supplemental Figures

Additional details on the fabrication of the exhibit
Supp. Fig. S1: To build the outer exhibit structure, we collaborated with Sol Vin, an exhibit design and construction company. A. CAD drawings by Sol Vin of the exhibit outer casing for the pilot version of the exhibit. B. Photo of the empty exhibit casing with the Sol Vin team. C. Sketch by Danbee Kim of the first design for the viewing port, showing location of eye-tracking cameras.
Additional details on the hardware inside the exhibit
Supp. Fig. S2: A. Photo of the main hardware components controlling the experiment embedded inside the exhibit. B. Collaborators Gonçalo Lopes and Darío R. Quiñones test the eye cameras. C. A view of the exhibit box, with front and side panels removed to install the internal components that will control the interactivity of the exhibit. D. A view of the hardware components on the shelves of the hidden compartment inside the exhibit box. E. A view through the prototype version of the viewing plate, which needs to hold the eye cameras in a good position for recording the eyes of the current participant.
Additional details on the improvements made in order to automate the exhibit
Supp. Fig. S3: Improvements made to the exhibit allowed it to collect data autonomously. A, B, and D by Sol Vin. A. A labeled mock-up of the improvements to be made on the exhibit casing. B. The front button panel lets participants choose between 5 languages: French, English, German, Italian, and Chinese. C. A photo of the exhibit after improvements. D. Side panels provide info previously provided by exhibit host.
Additional details on the improvements made to the viewing port of the exhibit
Supp. Fig. S4: A. CAD drawings by Sol Vin of the final version of the viewing port, designed for better hygiene and robustness. B. A new front panel offers specific instructions to curious passers-by; red box indicates location of viewplate where people look into the exhibit box. C. An ‘exploded view’ photo of the final version of the viewing port, with eye cameras from Pupil Labs.
Right pupil size during calibration sequence
Supp. Fig. S5: Raw traces of pupil size and x-axis motion (absolute value of movement) during the calibration sequence. A. Traces of the pupil sizes of all participants. B. Traces of the pupil motion of all participants. C. Average luminance of stimulus, as seen by world camera (see Fig 2) D. Screenshots of stimulus events labeled in subplot C.
Right pupil size during octopus sequence
Supp. Fig. S6: Raw traces of pupil size and x-axis motion (absolute value of movement) during the octopus sequence. A. Traces of the pupil sizes of all participants. B. Traces of the pupil motion of all participants. C. Average luminance of stimulus, as seen by world camera (see Fig. 2). D. Screenshots of stimulus events labeled in subplot C.
Right pupil sizes during calibration sequence.
Supp. Fig. 7: Mean pupil size of right eyes during the calibration sequence. A. Traces of pupil sizes for all participants. B. Mean pupil sizes with 95% confidence interval. C. Average luminance of stimulus, as seen by world camera. D. Screenshots of stimulus events labeled in subplot C.
Right pupil sizes during octopus sequence.
Supp. Fig. 7: Mean pupil size of right eyes during the octopus sequence. A. Traces of pupil sizes for all participants. B. Mean pupil sizes with 95% confidence interval. C. Average luminance of stimulus, as seen by world camera. D. Screenshots of stimulus events labeled in subplot C.
Interesting moments in unique sequence 01, found using population saccade statistics on left pupil x-axis motion
Supp. Fig. S9: Saccades pooled across many subjects can reveal salient events during visual sequences, such as the moment people notice a pouncing cat. See Supp. Vids 1 to watch full videos of all unique sequences. A. Mean pupil size with 95% confidence interval. B. Mean pupil motion with 95% confidence interval. C. Raster of ‘small saccades’, pooled across all participants who watched this unique sequence. D. Average luminance of stimulus, as seen by world camera. E. Screenshots of stimulus events labeled in subplot D.
Interesting moments in unique sequence 02, found using population saccade statistics on left pupil x-axis motion
Supp. Fig. S10: Saccades pooled across many subjects can reveal salient events during visual sequences, such as a bird eating bread crumbs out of someone’s fingers. See Supp. Vids 1 to watch full videos of all unique sequences. A. Mean pupil size with 95% confidence interval. B. Mean pupil motion with 95% confidence interval. C. Raster of ‘small saccades’, pooled across all participants who watched this unique sequence. D. Average luminance of stimulus, as seen by world camera. E. Screenshots of stimulus events labeled in subplot D.
Interesting moments in unique sequence 03, found using population saccade statistics on left pupil x-axis motion
Supp. Fig. S11: Pooled saccades are less informative during more subtle visual sequences, such as changes to body pattern of a cuttlefish sitting still. See Supp. Vids 1 to watch full videos of all unique sequences. A. Mean pupil size with 95% confidence interval. B. Mean pupil motion with 95% confidence interval. C. Raster of ‘small saccades’, pooled across all participants who watched this unique sequence. D. Average luminance of stimulus, as seen by world camera. E. Screenshots of stimulus events labeled in subplot D.
Interesting moments in unique sequence 04, found using population saccade statistics on left pupil x-axis motion
Supp. Fig. S12: Pooled saccades are less informative during more predictable visual sequences, such as a cuttlefish swimming towards a robotic prey. See Supp. Vids 1 to watch full videos of all unique sequences. A. Mean pupil size with 95% confidence interval. B. Mean pupil motion with 95% confidence interval. C. Raster of ‘small saccades’, pooled across all participants who watched this unique sequence. D. Average luminance of stimulus, as seen by world camera. E. Screenshots of stimulus events labeled in subplot D.
Interesting moments in unique sequence 05, found using population saccade statistics on left pupil x-axis motion
Supp. Fig. S13: Pooled saccades are less informative during more chaotic visual sequences, such as a moving through a busy coral reef. See Supp. Vids 1 to watch full videos of all unique sequences. A. Mean pupil size with 95% confidence interval. B. Mean pupil motion with 95% confidence interval. C. Raster of ‘small saccades’, pooled across all participants who watched this unique sequence. D. Average luminance of stimulus, as seen by world camera. E. Screenshots of stimulus events labeled in subplot D.
Interesting moments in unique sequence 06, found using population saccade statistics on left pupil x-axis motion
Supp. Fig. S14: Pooled saccades are less informative during more subtle visual sequences, such as a video edited to mirror the frame down the middle. See Supp. Vids 1 to watch full videos of all unique sequences. A. Mean pupil size with 95% confidence interval. B. Mean pupil motion with 95% confidence interval. C. Raster of ‘small saccades’, pooled across all participants who watched this unique sequence. D. Average luminance of stimulus, as seen by world camera. E. Screenshots of stimulus events labeled in subplot D.

Supplemental Videos

SV1: Video wall display

The Surprising Minds exhibit at Sea Life Brighton included a video summarizing the Cuttle Shuttle project and introducing the concepts behind Surprising Minds:

SV2: “Resting state” video

This video played on all external monitors of the exhibit when no one had activated the experiment yet:

SV3: “Please center your eye”

As soon as anyone activated the experiment by pressing a language button on the front of the exhibit, they were shown the view from the two “eye cameras” so that they could adjust the location of their eyes in the cameras’ fields of view. In these videos, the feed from the eye cameras were displayed in the white box in the middle of the frame:

English:

French:

German:

Italian:

Chinese:

SV4: “Do not move”

Once participants had centered their eyes in the field of view of the eye cameras, they were given one last reminder to keep their heads still, as this facilitates better eye tracking during analysis:

English:

French:

German:

Italian:

Chinese:

SV5: Calibration sequence

The experiment began with a calibration sequence, to help us benchmark the experimental setup and context:

SV6: Experimental stimulus sequences

After the calibration sequence, participants were shown one of six unique video clips. The experiment coordinating software (Bonsai RX) picked the unique sequence randomly. Afterwards, all participants watched the same video of an octopus de-camouflaging (video credit: Dr. Roger Hanlon, Woods Hole, USA).

Experimental stimulus 01:

Experimental stimulus 02:

Experimental stimulus 03:

Experimental stimulus 04:

Experimental stimulus 05:

Experimental stimulus 06:

SV7: Replay recordings from eye cameras

After the octopus sequence, all participants were instructed to watch the external monitors for a replay of the video recording of their eyes during the calibration, unique, and octopus sequences:

English:

French:

German:

Italian:

Chinese: